Turing clouds
A Turing cloud is a complex and visually striking system that evolves over time out of a simple set of rules. It can be viewed either as a full-color image, or as a heatmap visualization of a set of four-dimensional data points. Turing clouds are an extension of Jonathan McCabe’s Multi-Scale Turing Patterns which adds smooth coloring and the heatmap visualization.
The images and videos here have all been generated by a new piece of software I’ve written, called Zounds. In this initial version, it can generate Turing clouds, multi-scale Turing patterns, and John Conway’s Game of Life. It can generate patterns quickly enough that they can be playfully interacted with, and it provides a few different ways to have those interactions.
I have a detailed description of how Turing clouds are made, as well as some notes on how to set up a dedicated installation of the software. But you might just want to start by seeing some.
Videos
The first video shows me playing with a dedicated installation of Turing clouds.
The next three are all different views of a single thing - starting the system with the random seed 14, and letting it evolve at 1440x720 resolution for 3600 timesteps.
The next three are also different views of one thing - starting the system with the random seed 42, and letting it evolve at 1920x1080 resolution for 3600 timesteps.
Images
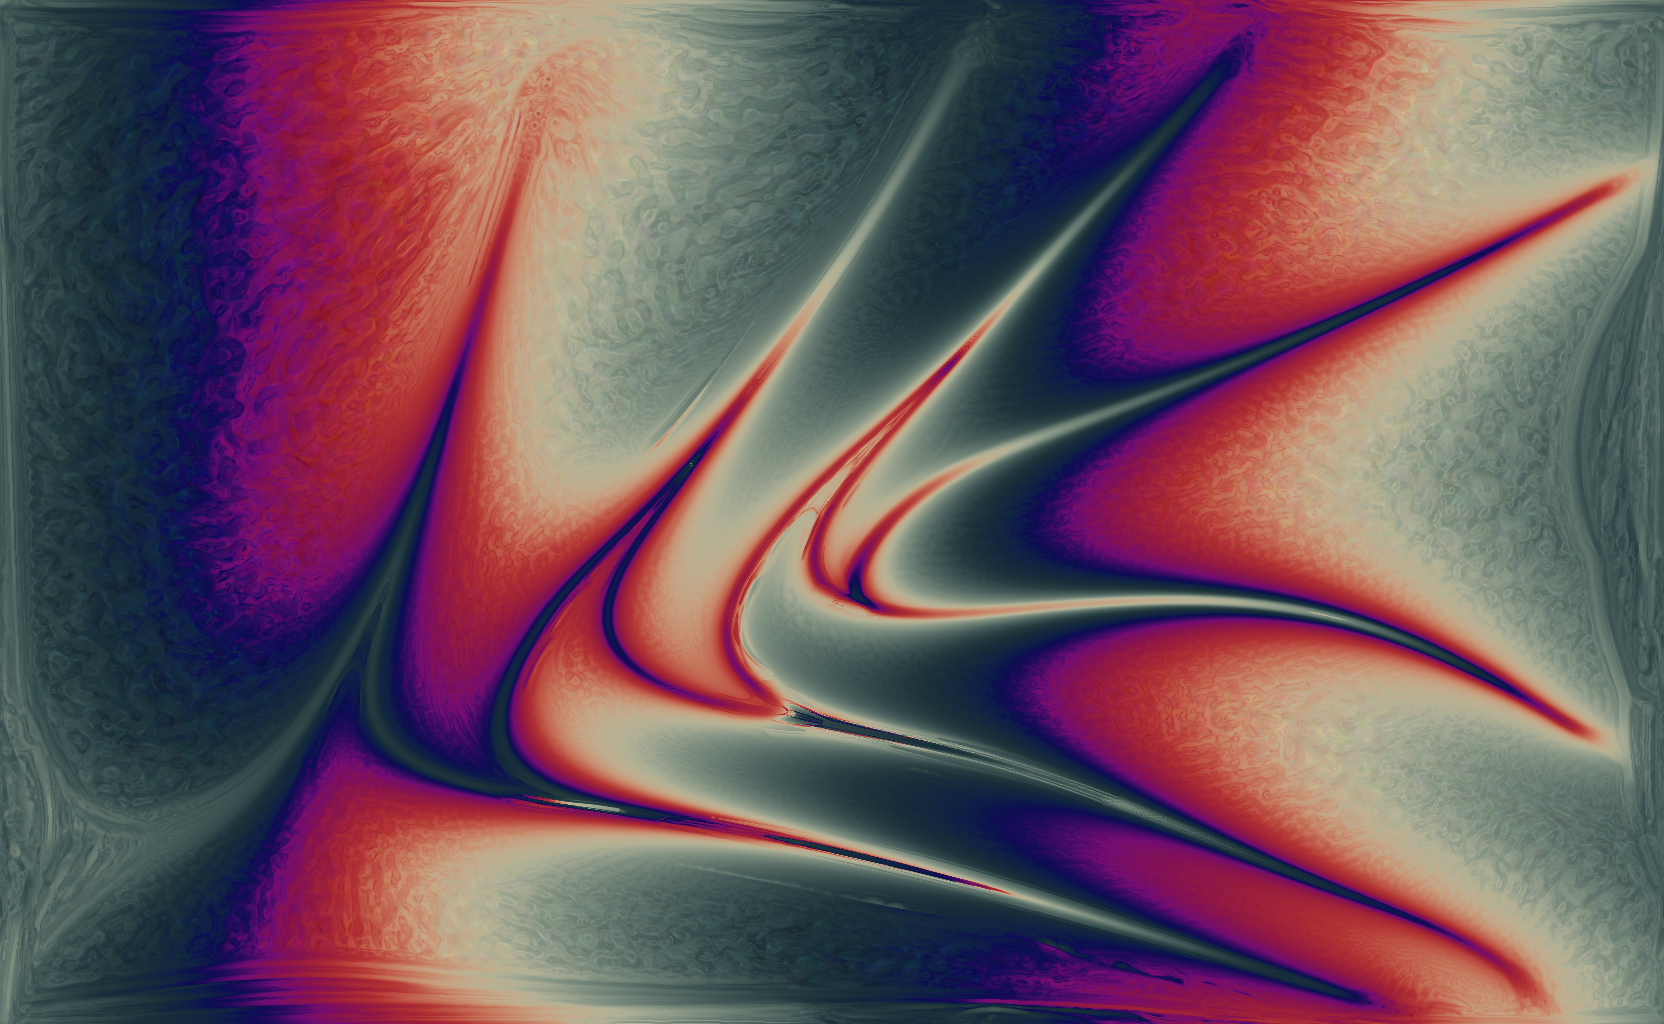
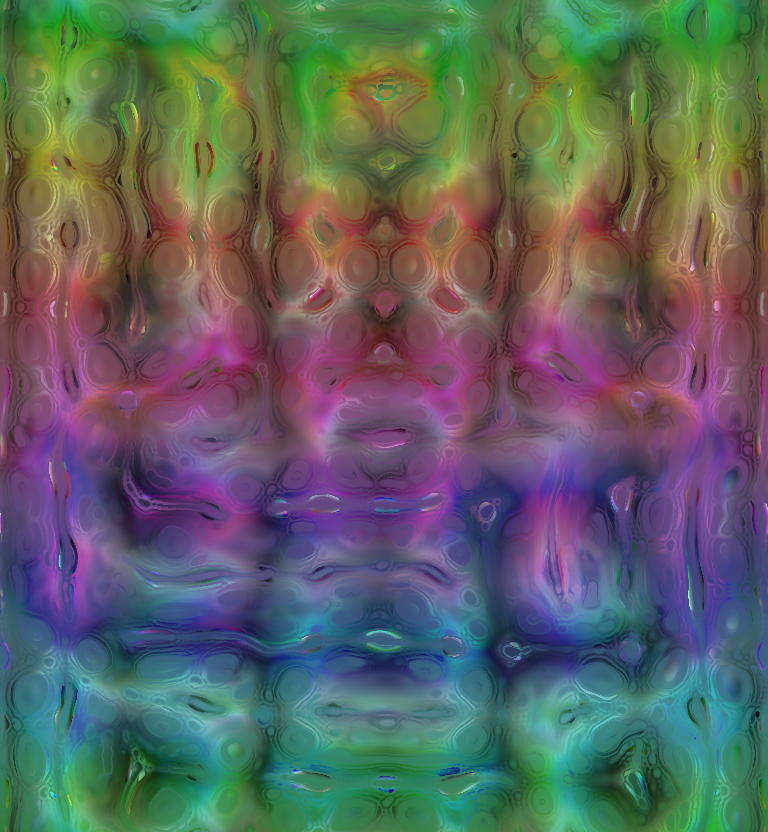
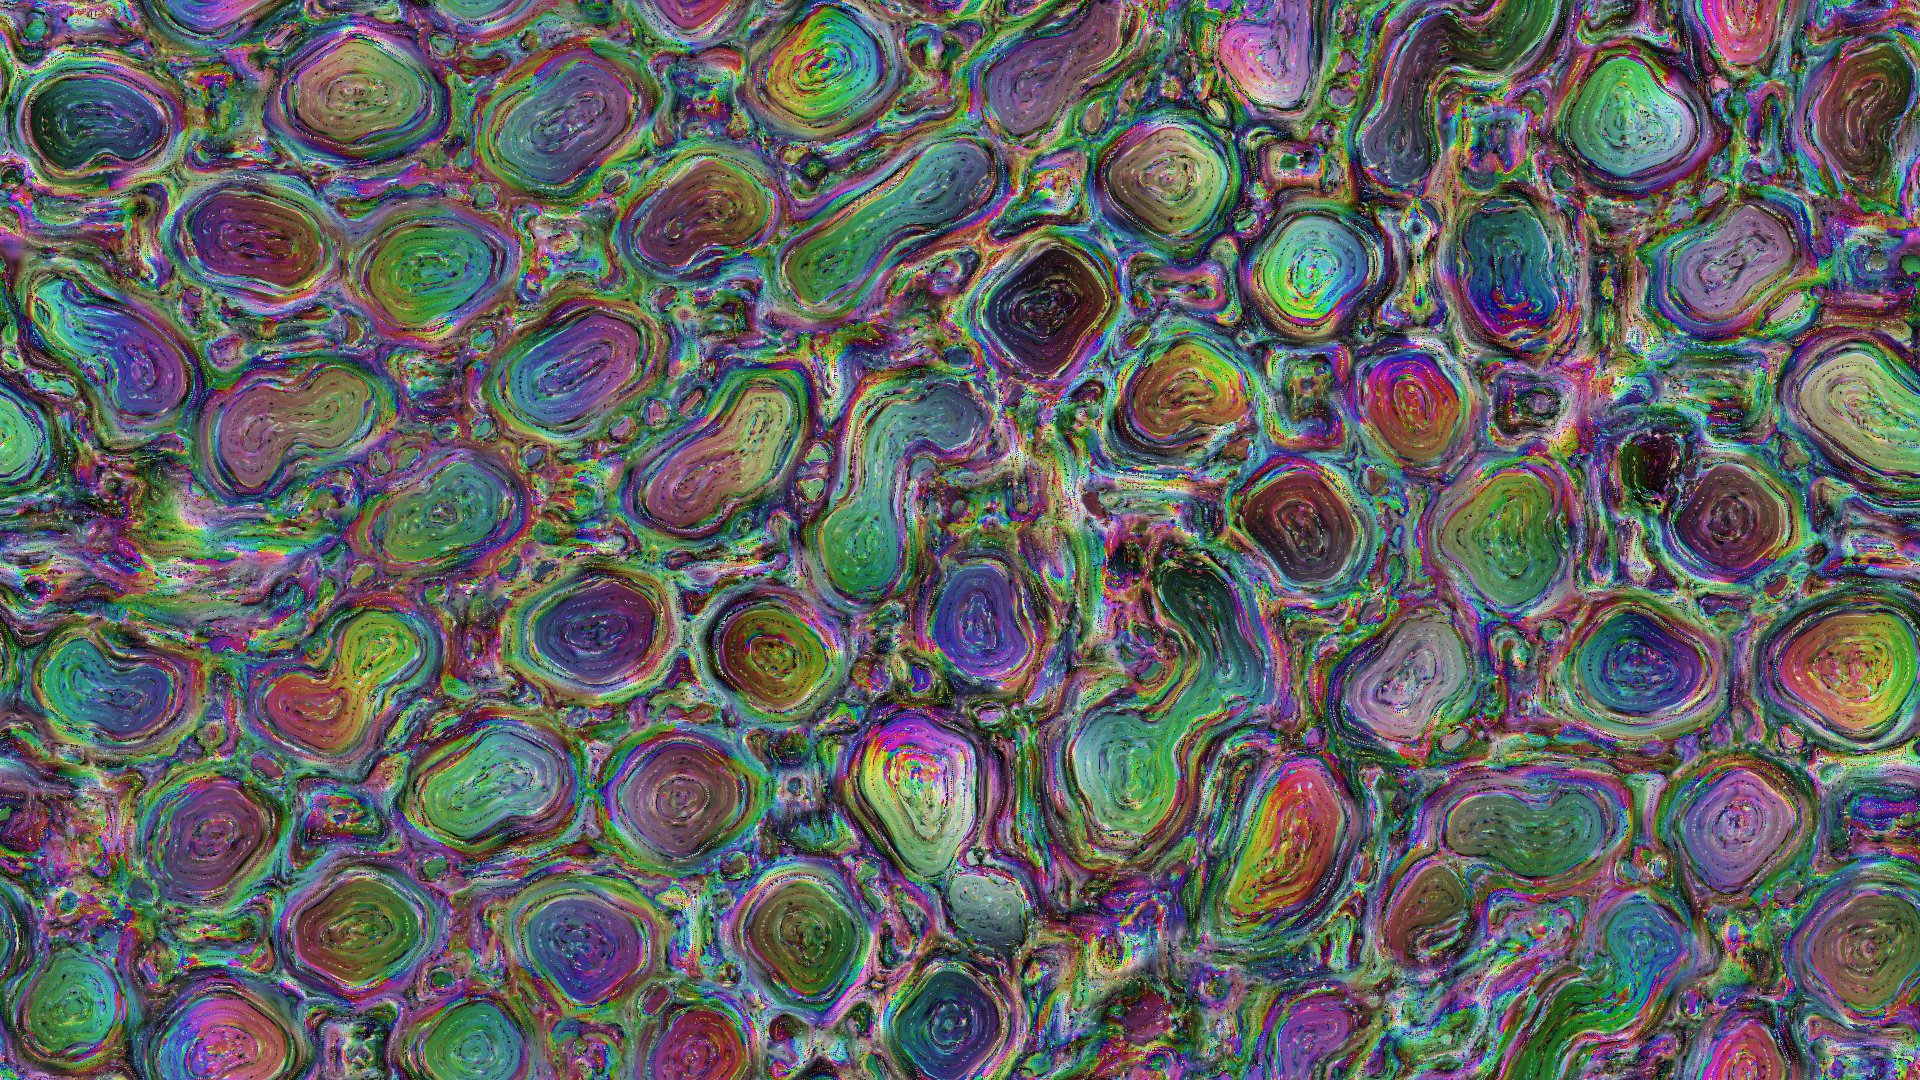
These are some sample images created by the system. Click any individual image to see it at full size. Images may be redistributed under the terms of the CC BY-SA 4.0 license.
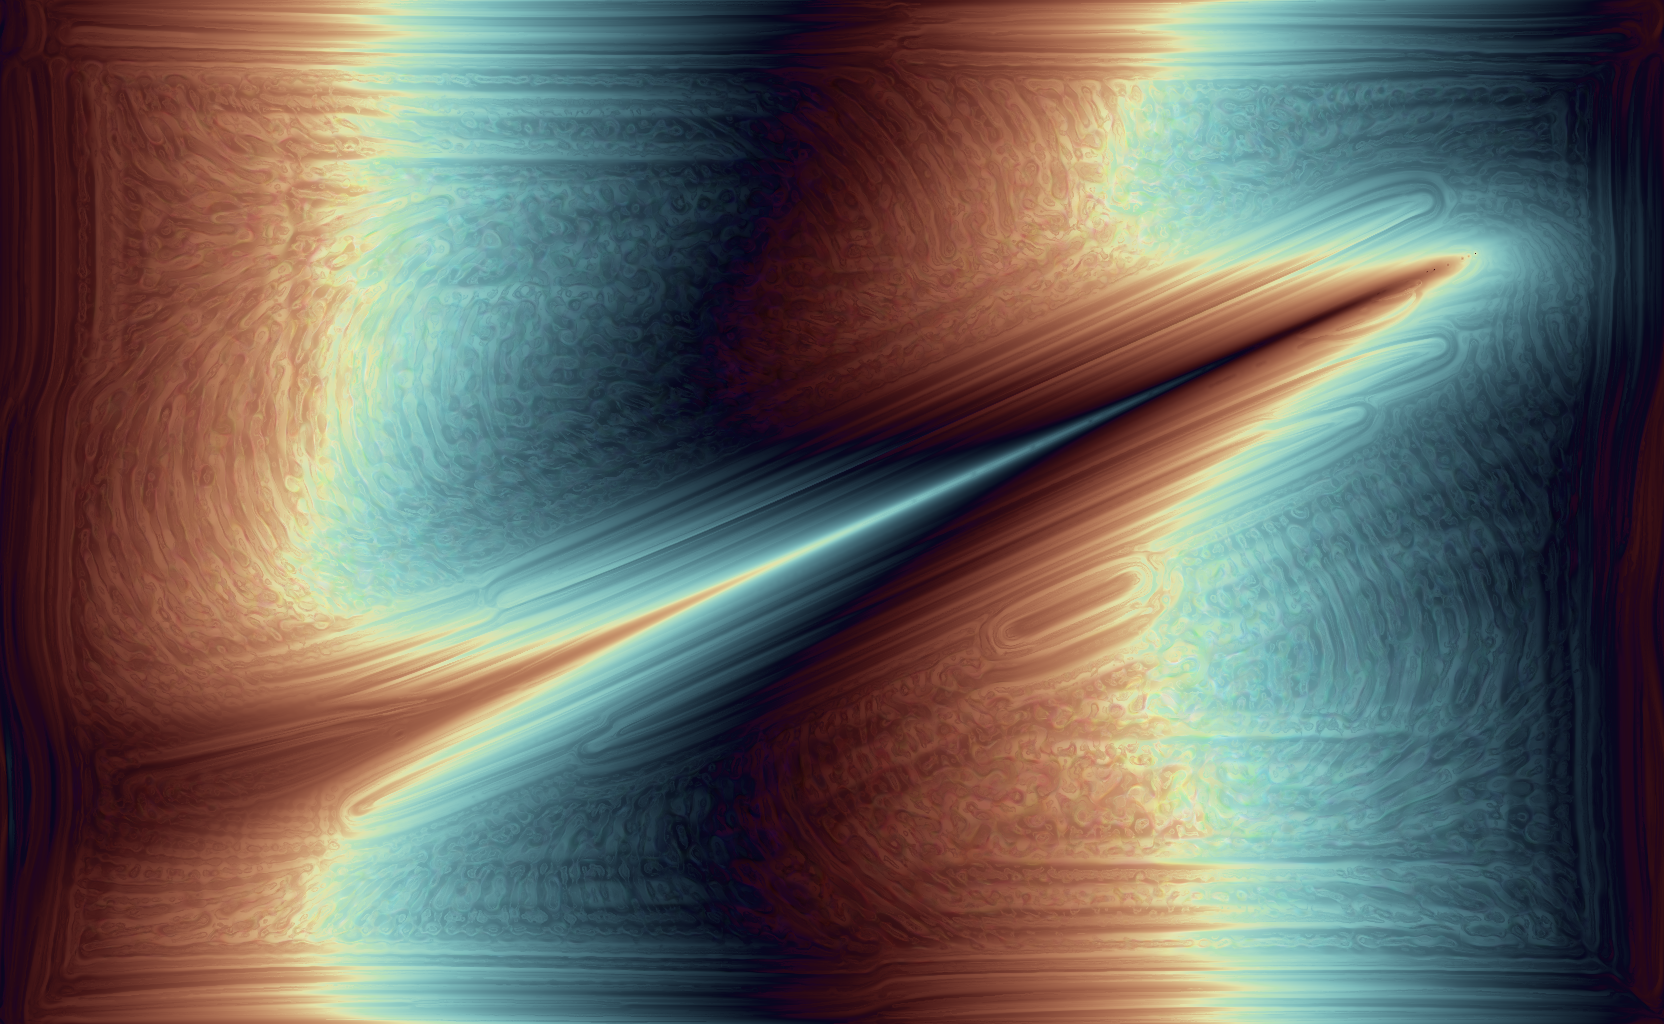
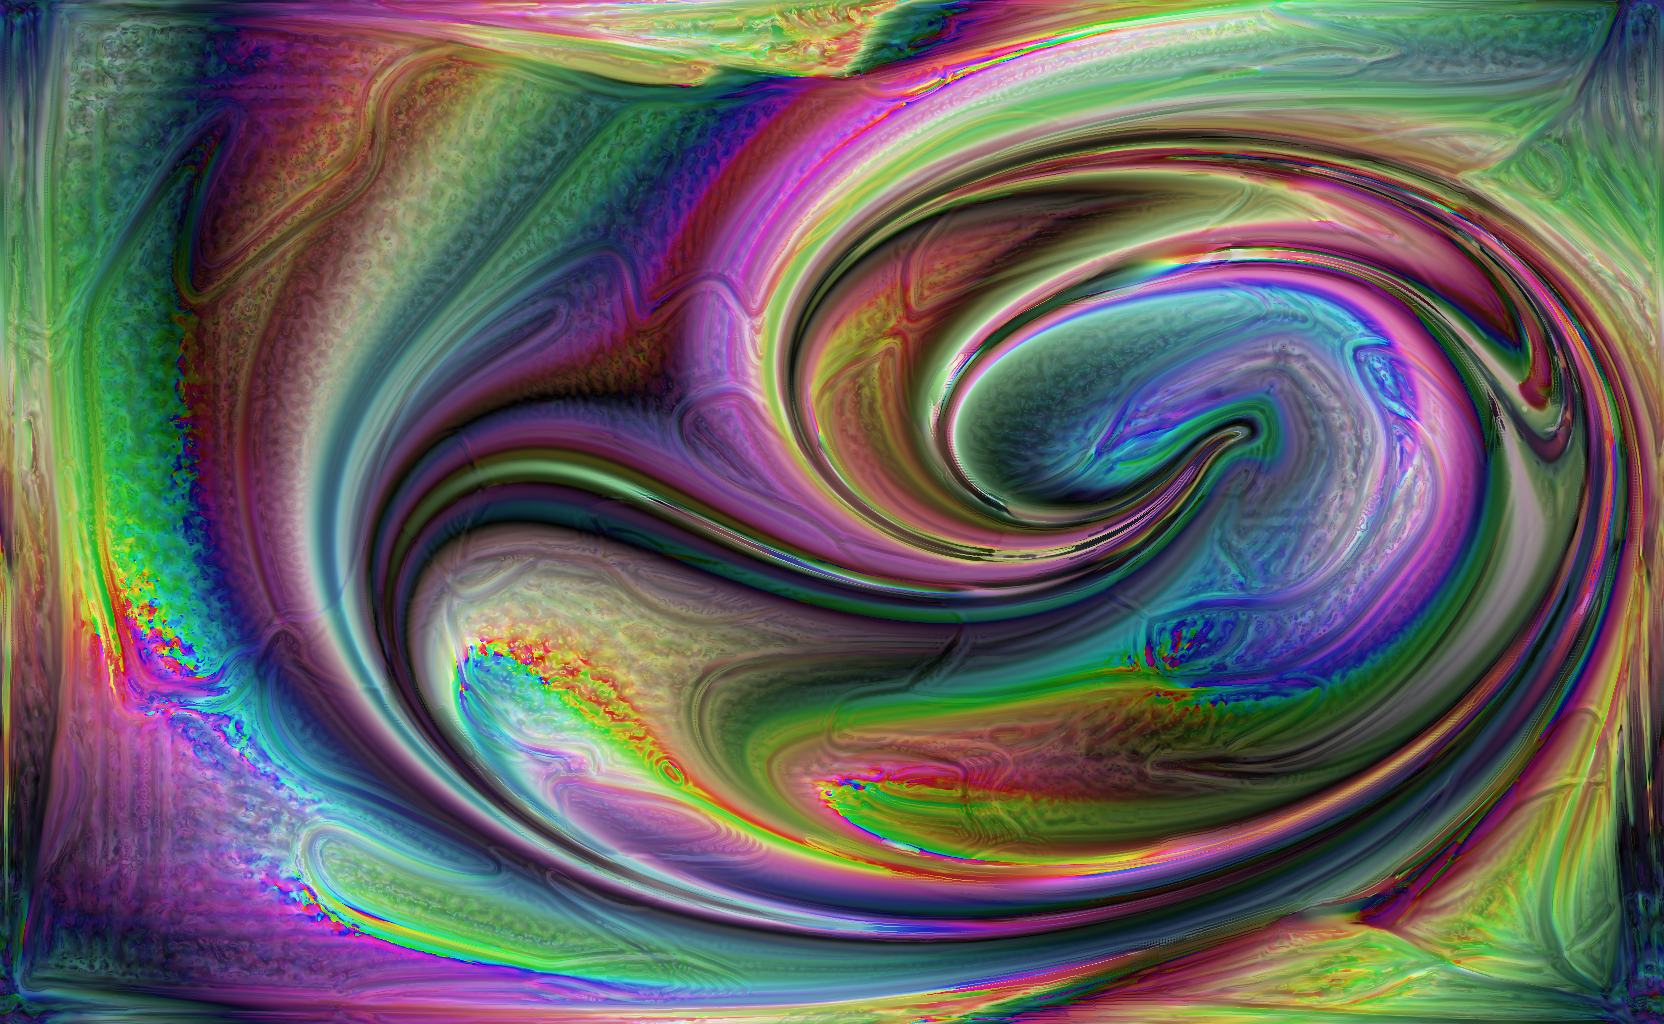
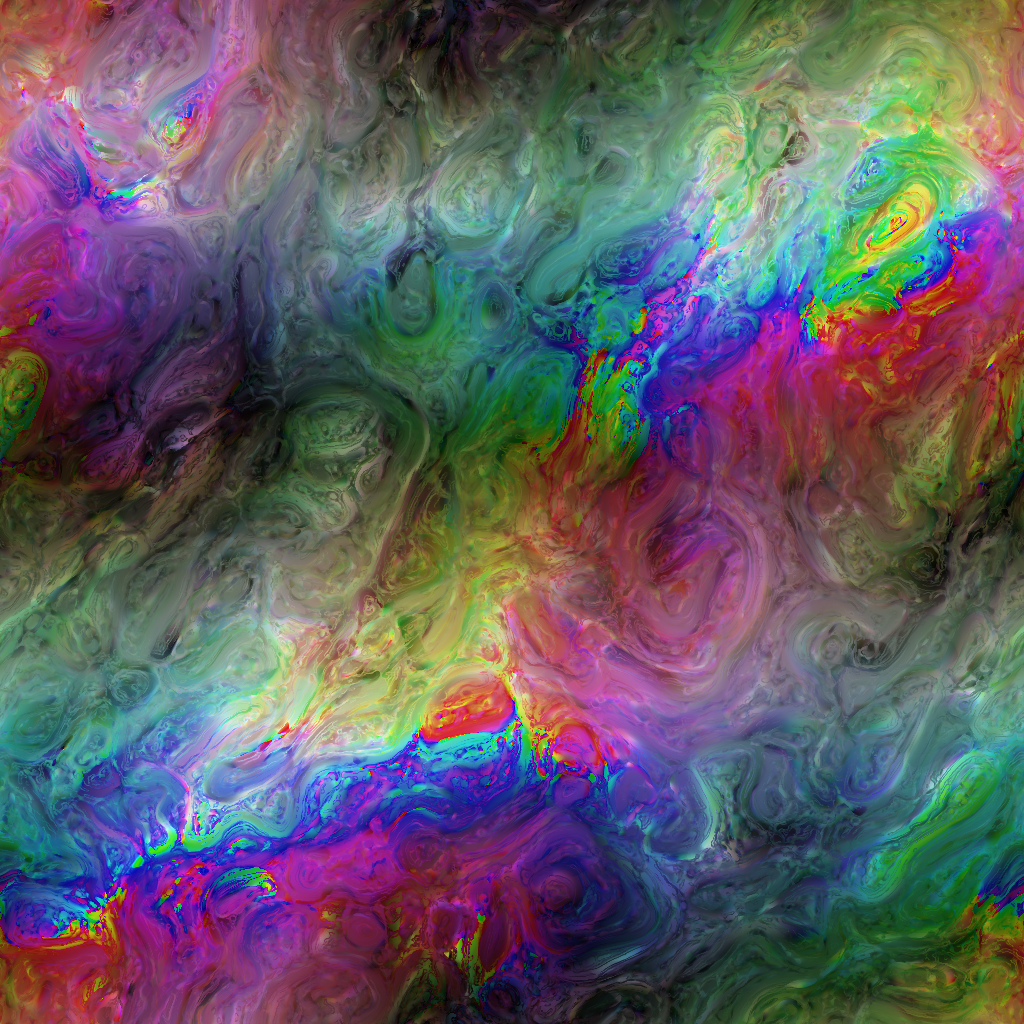
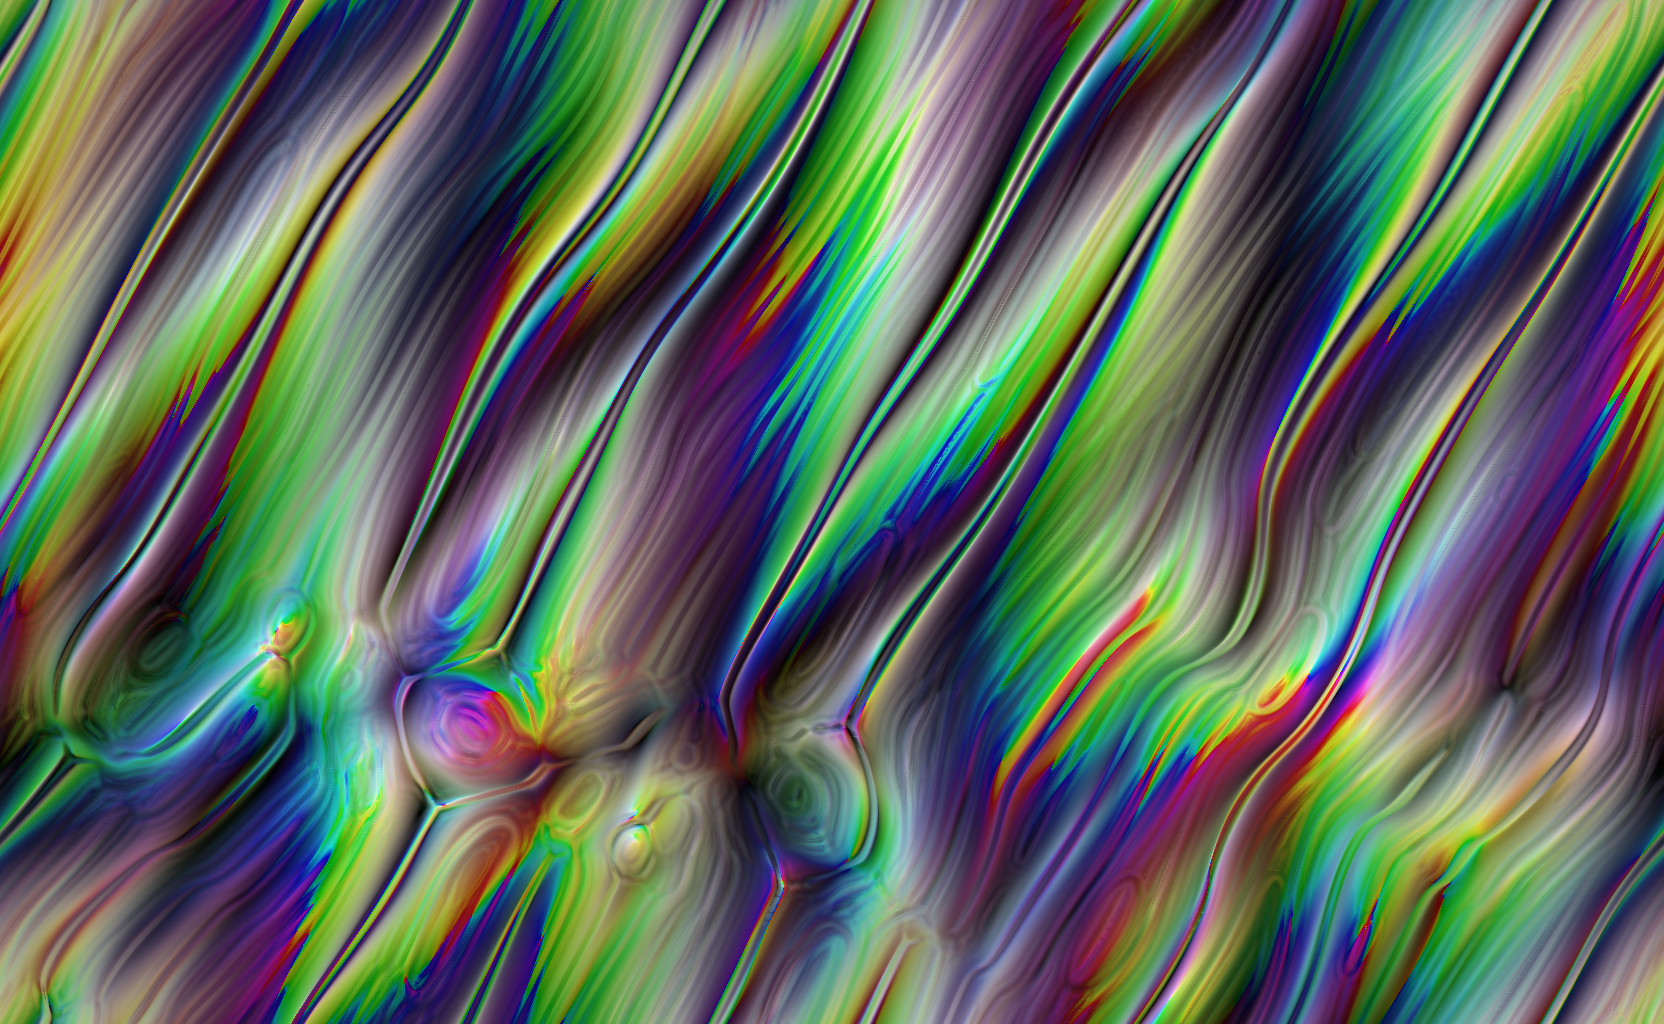
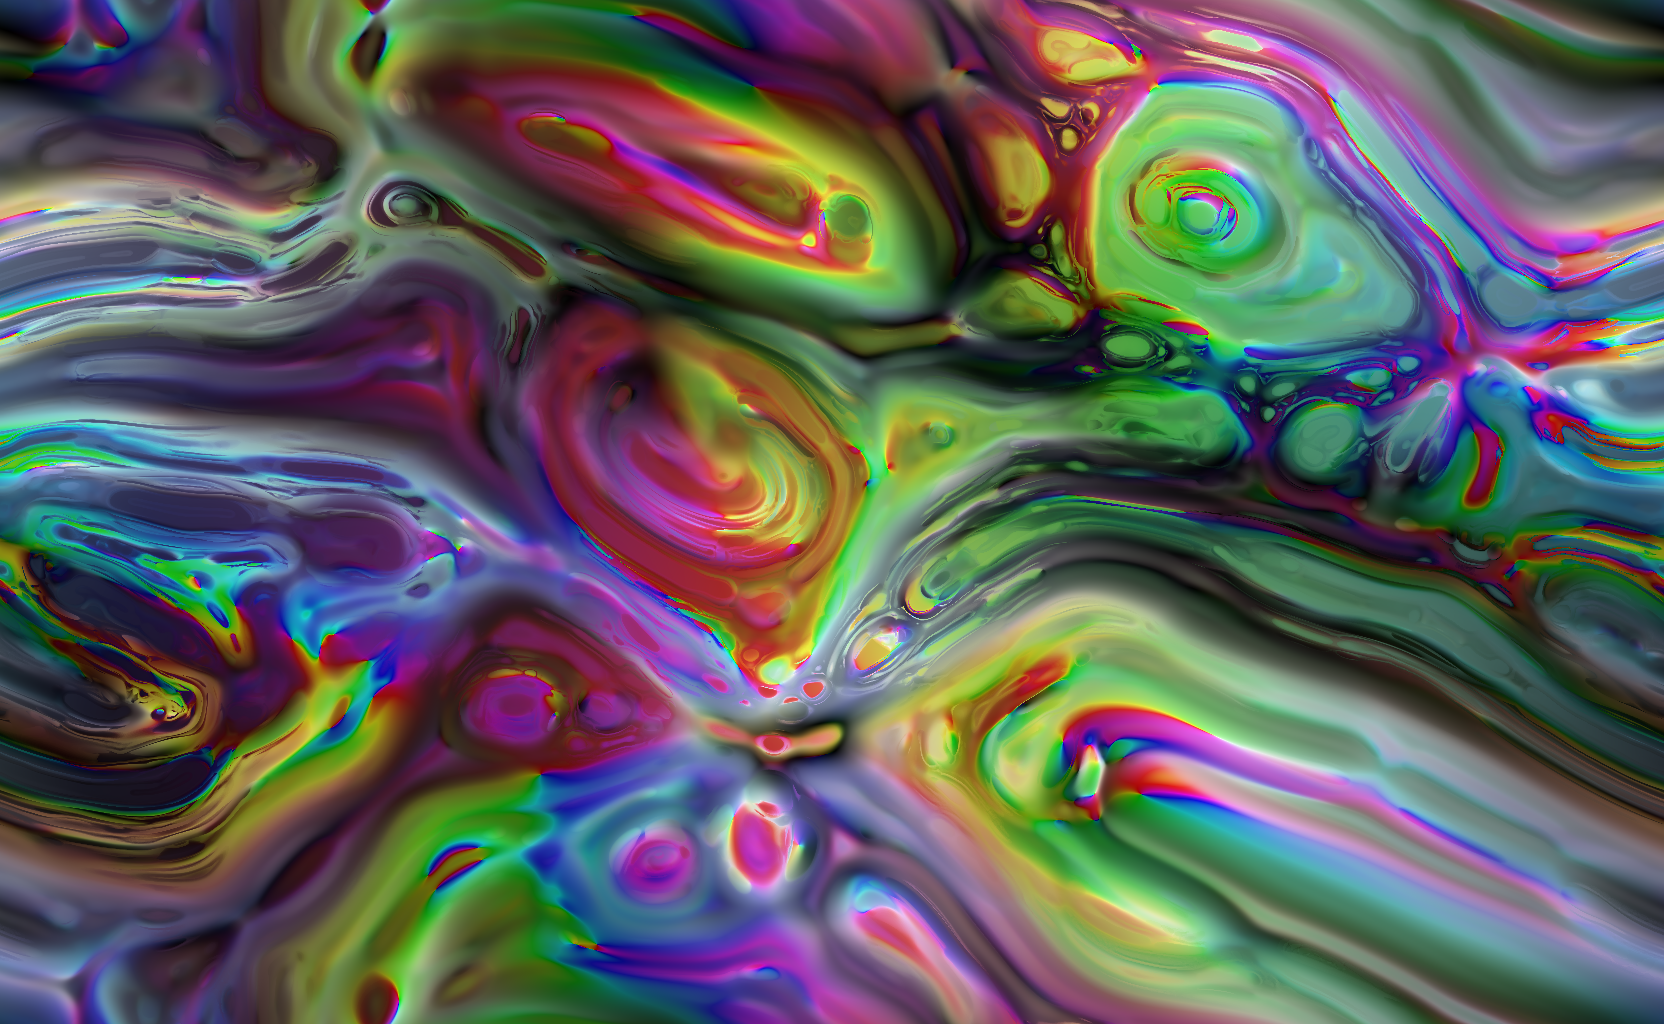
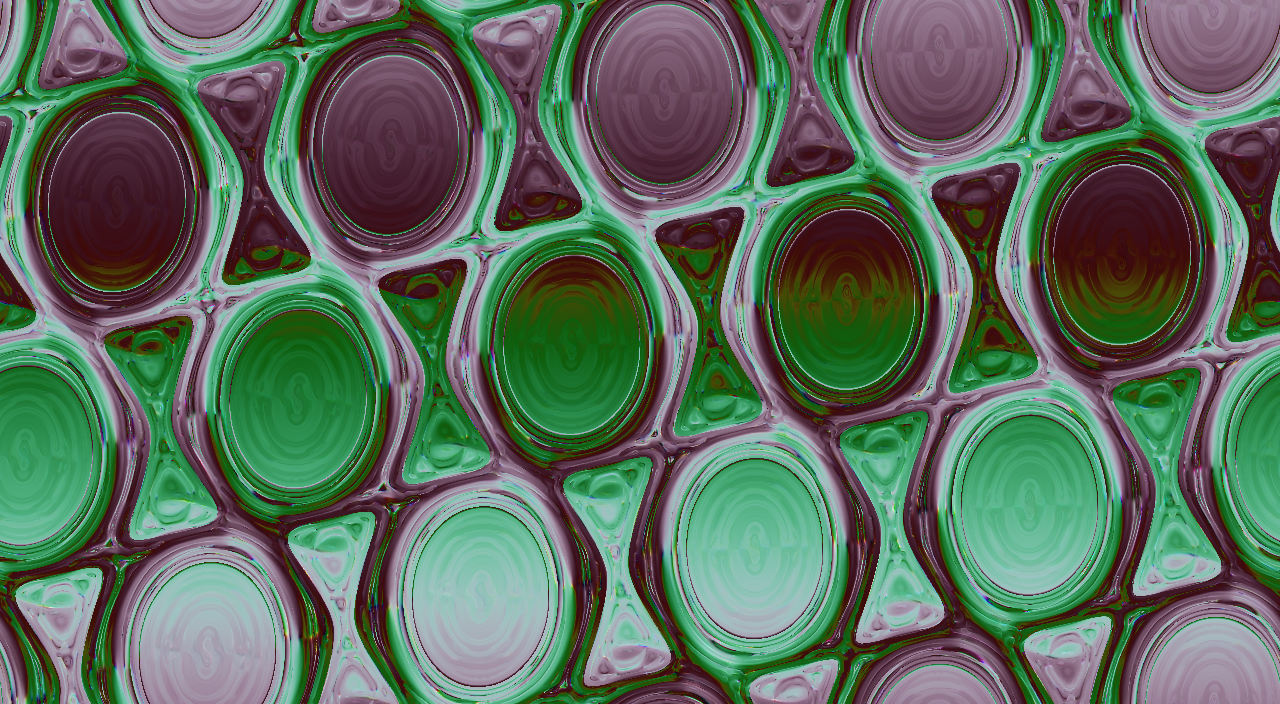
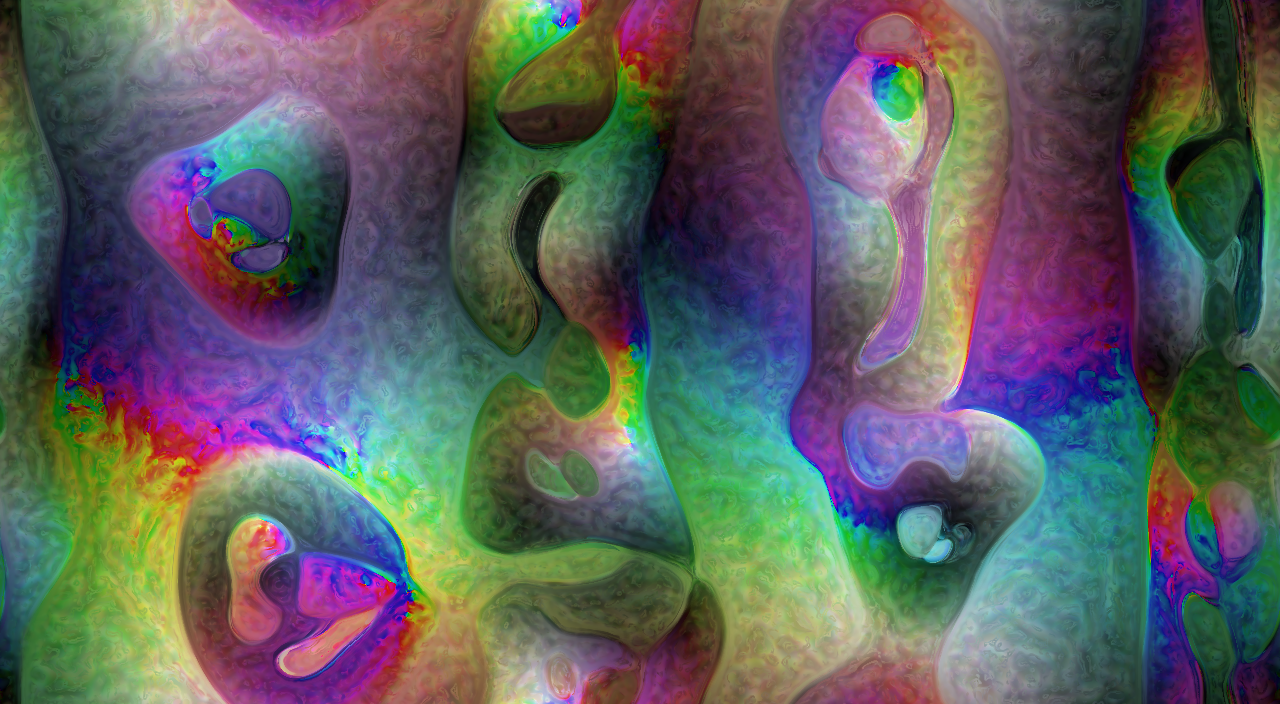
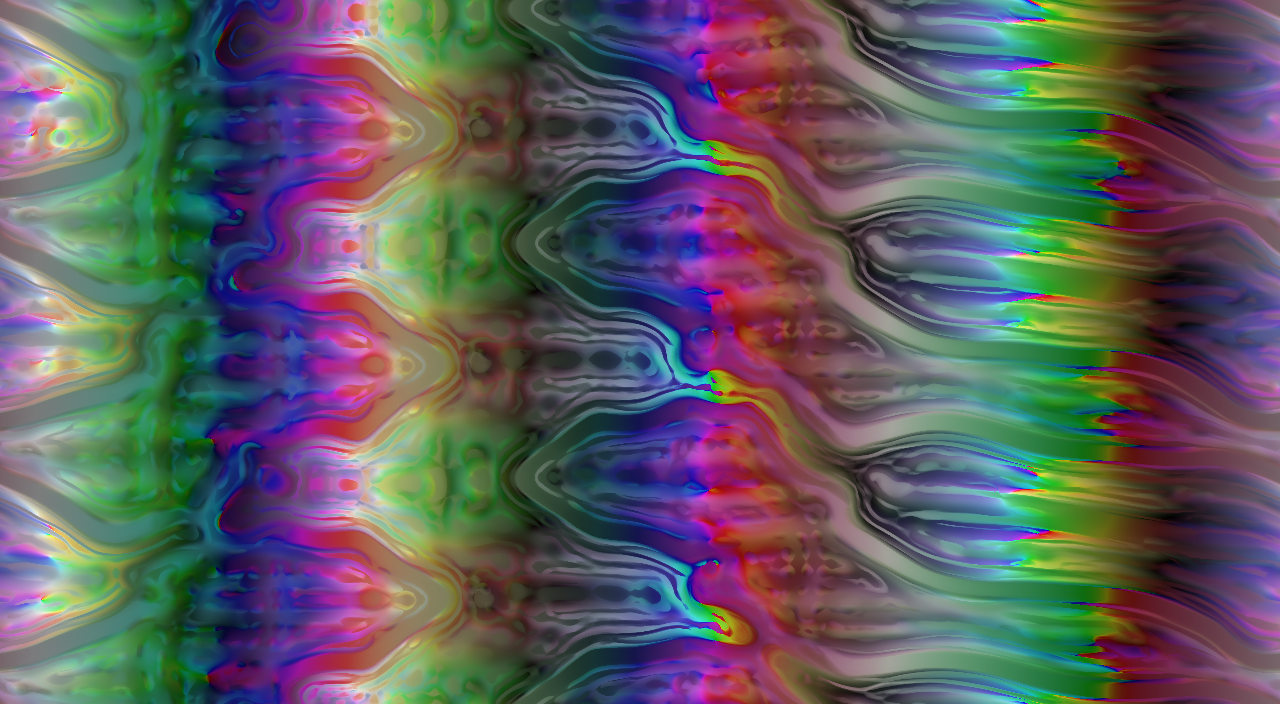
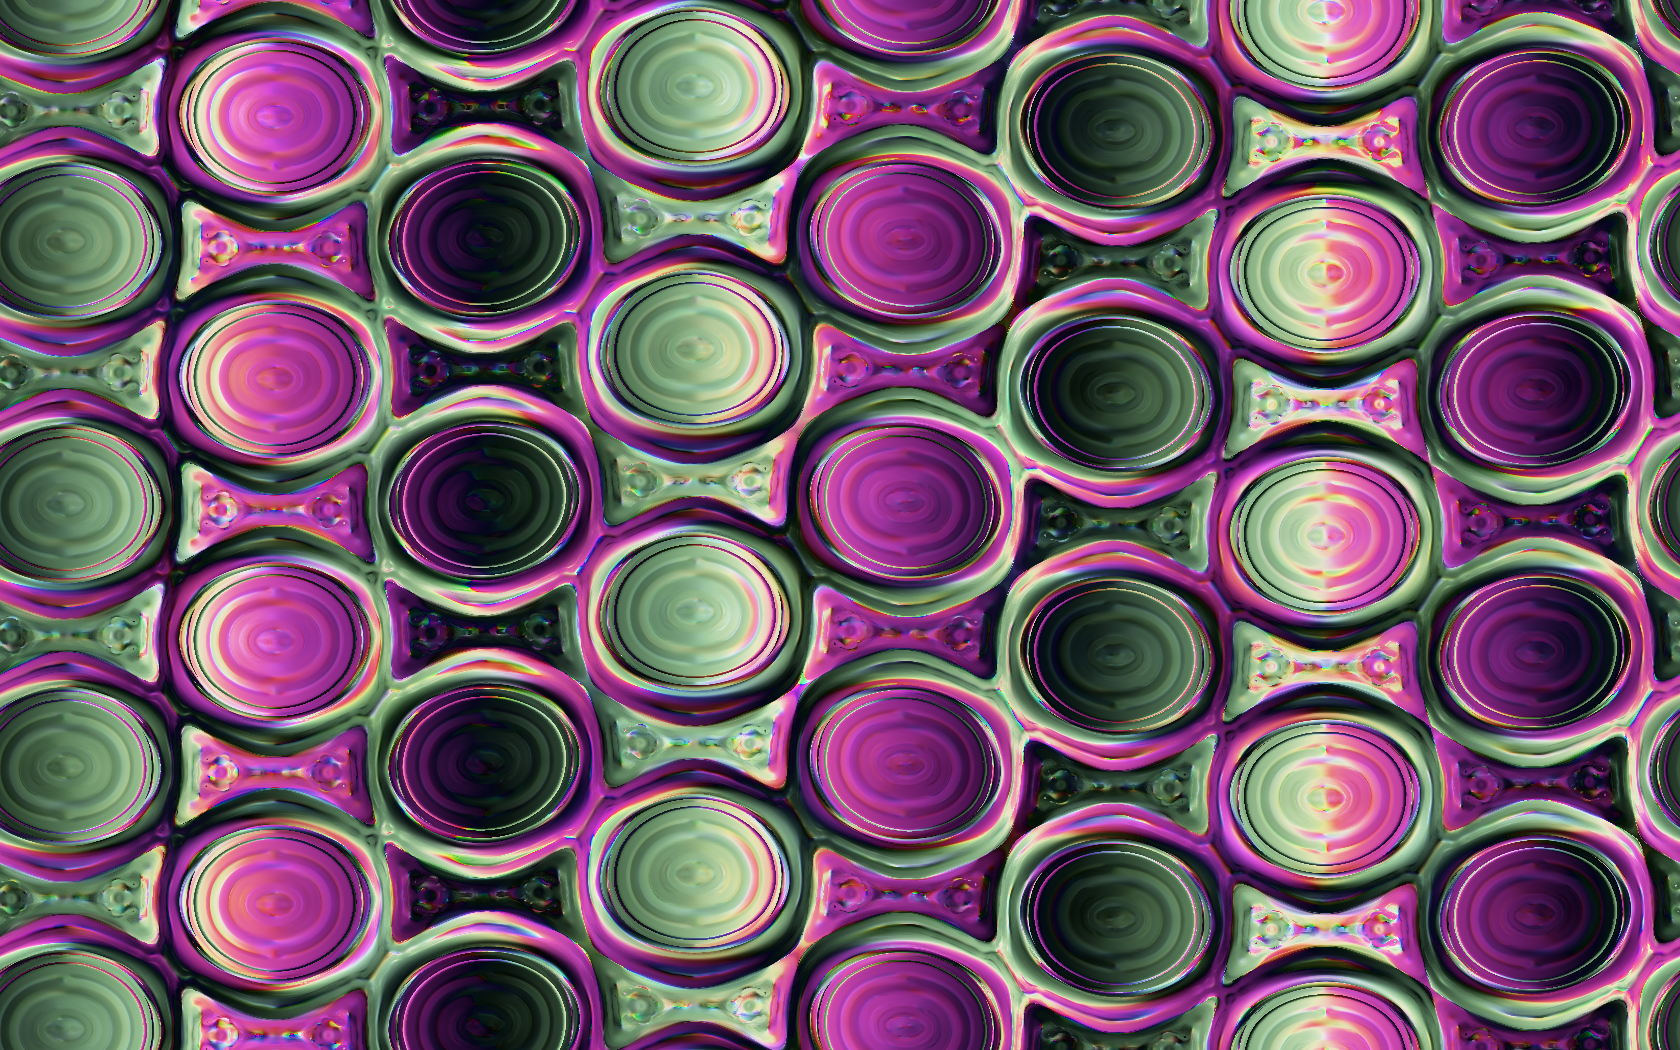
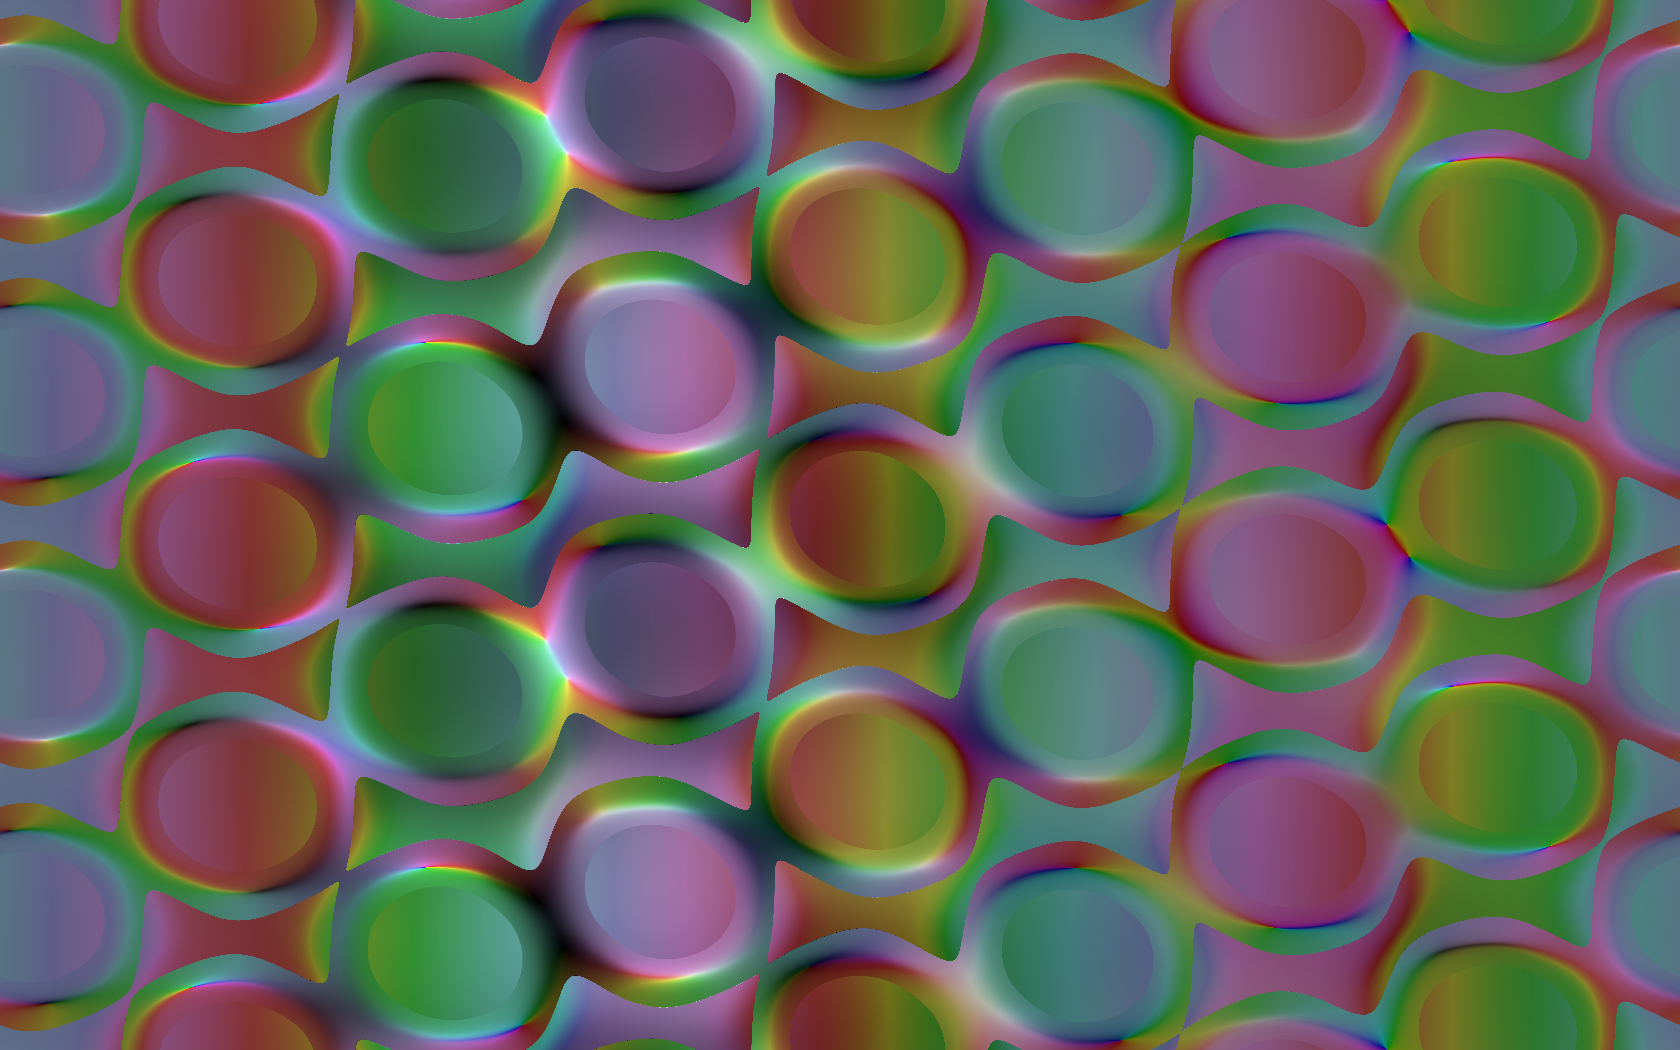
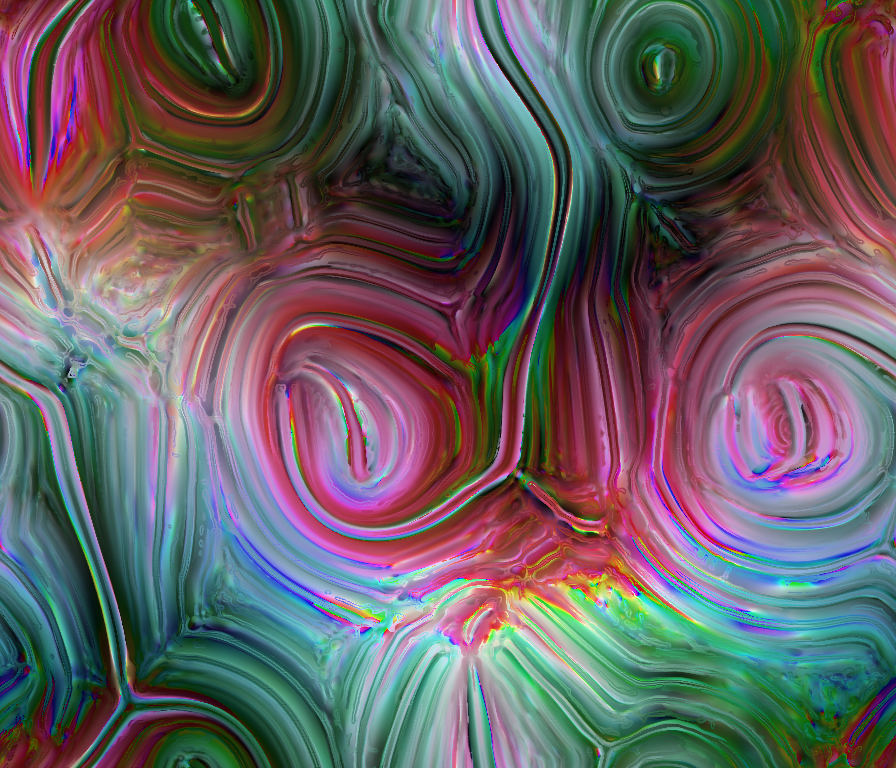
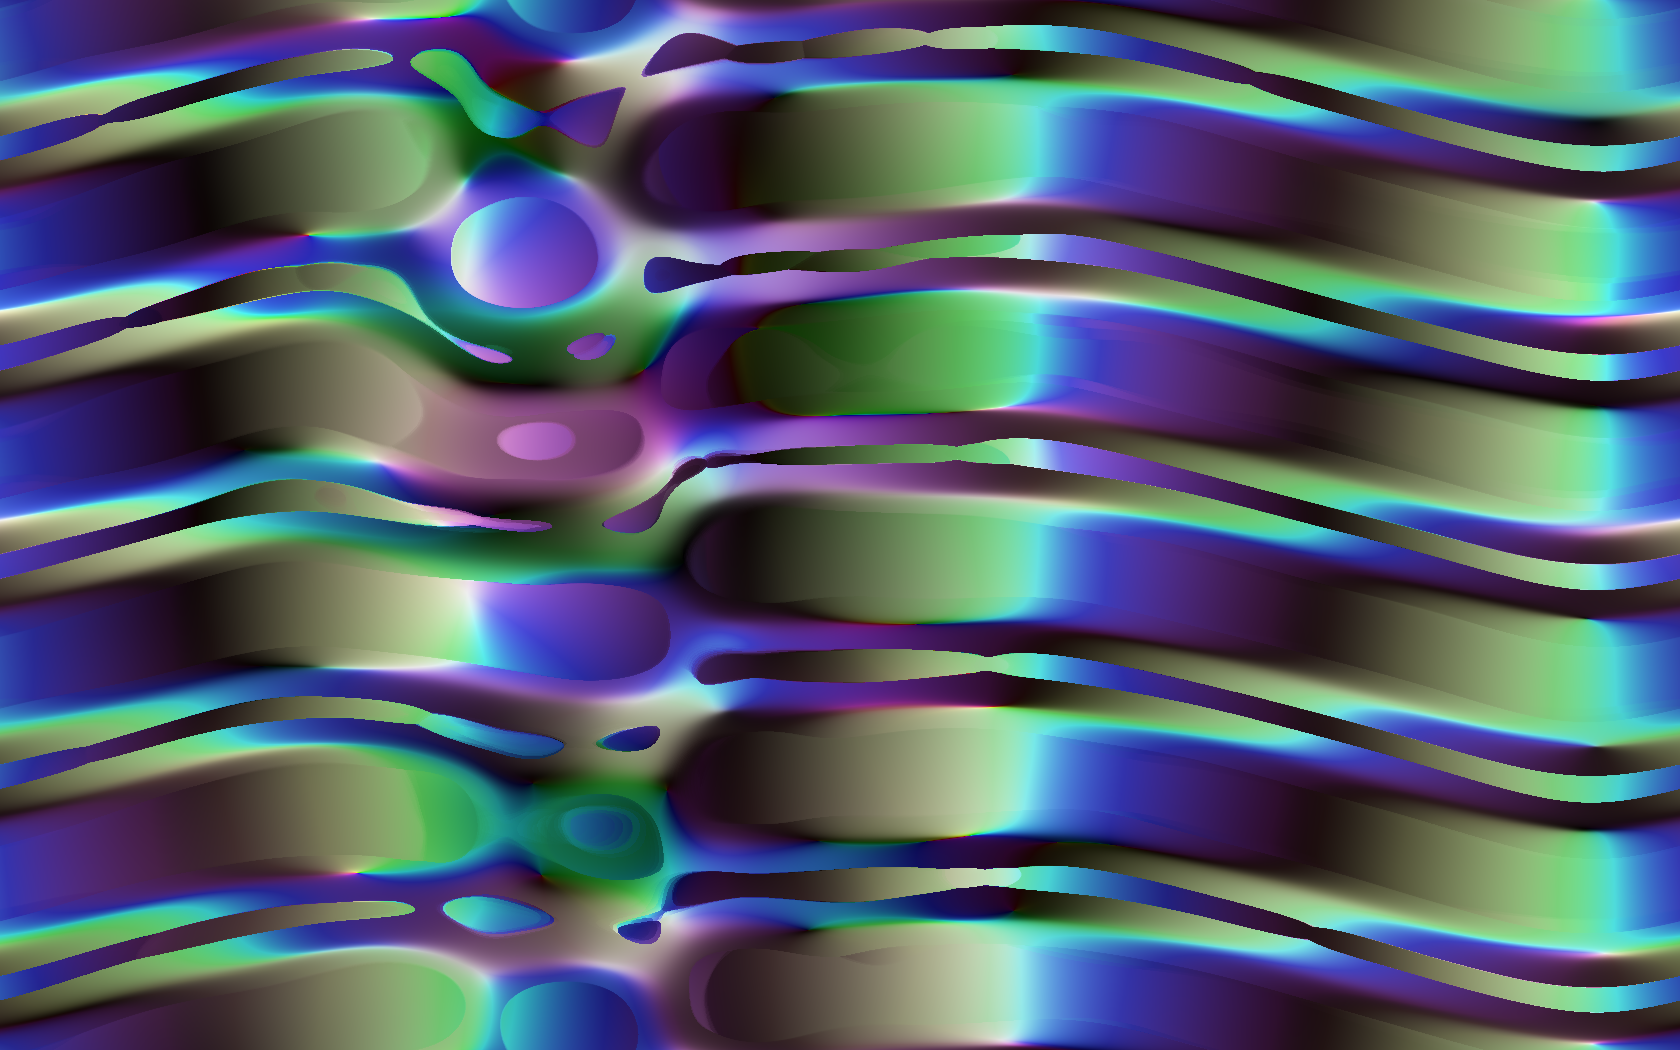
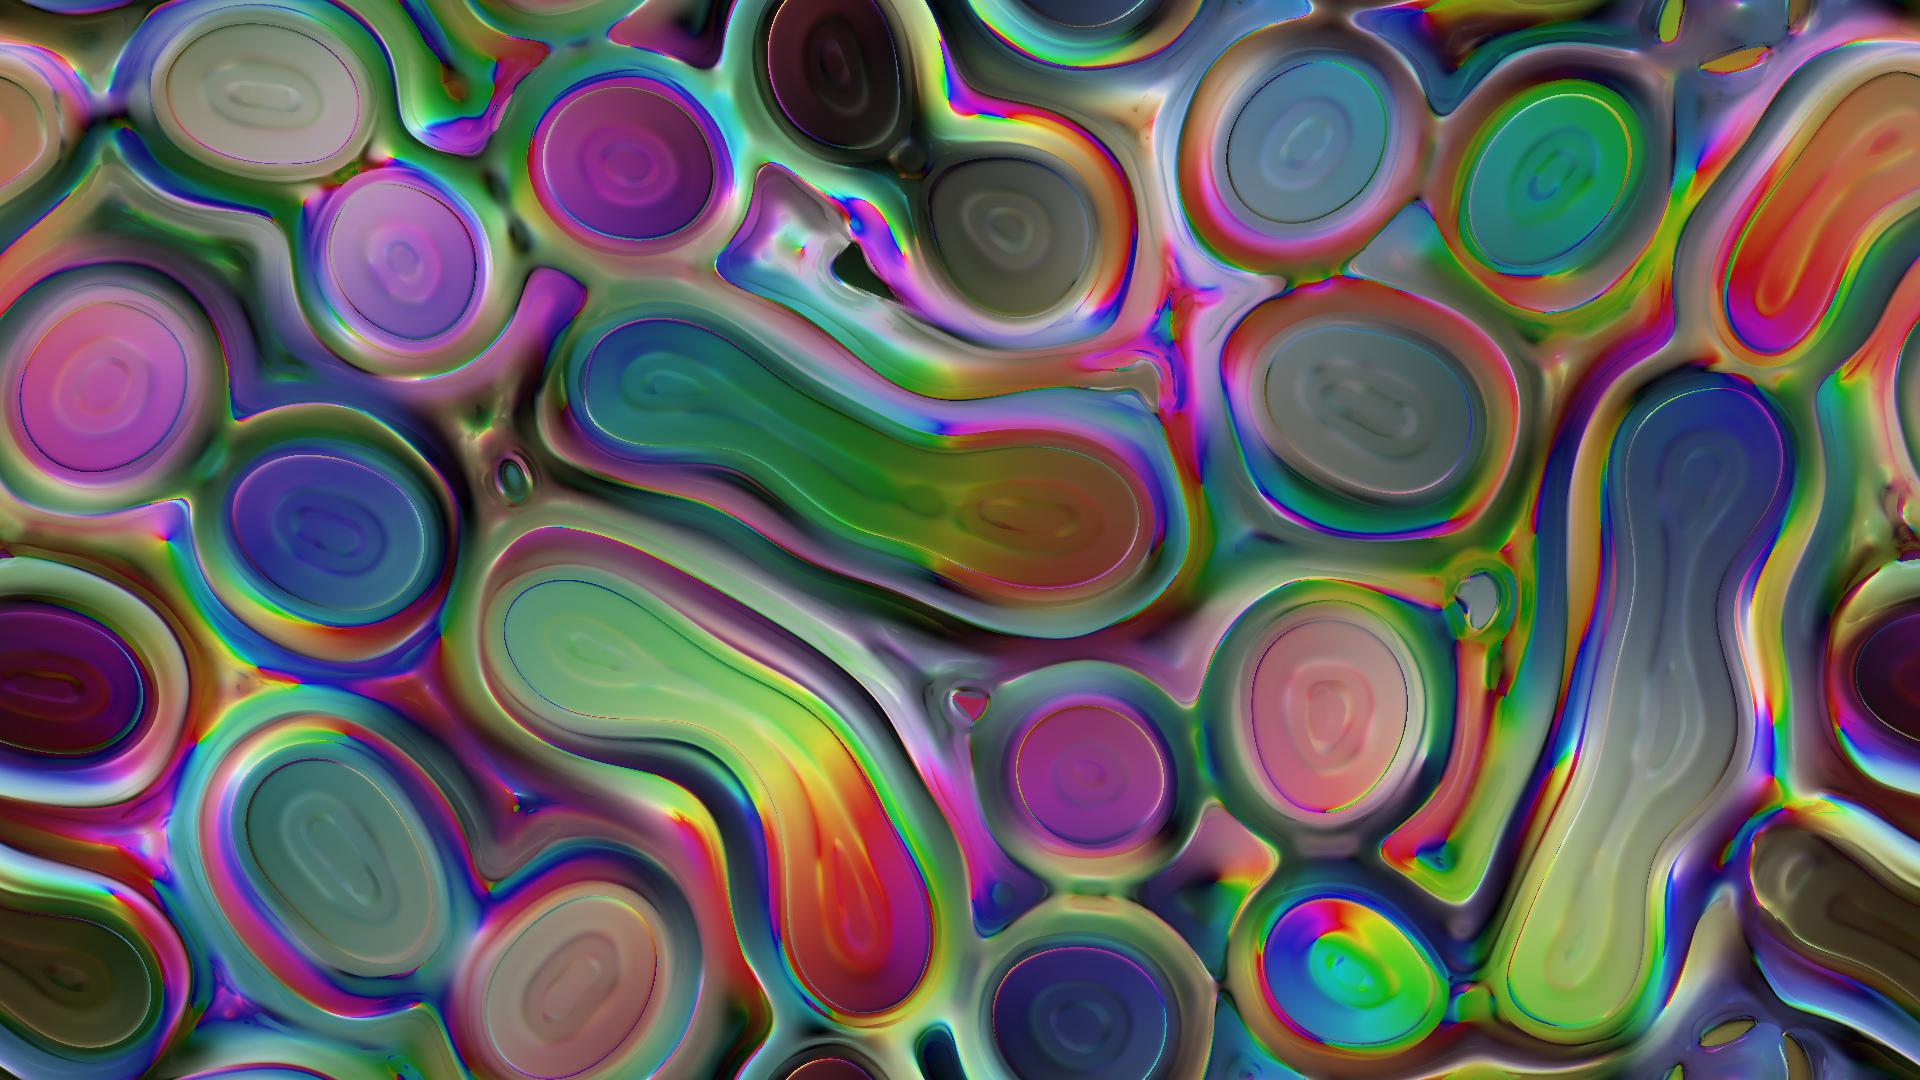
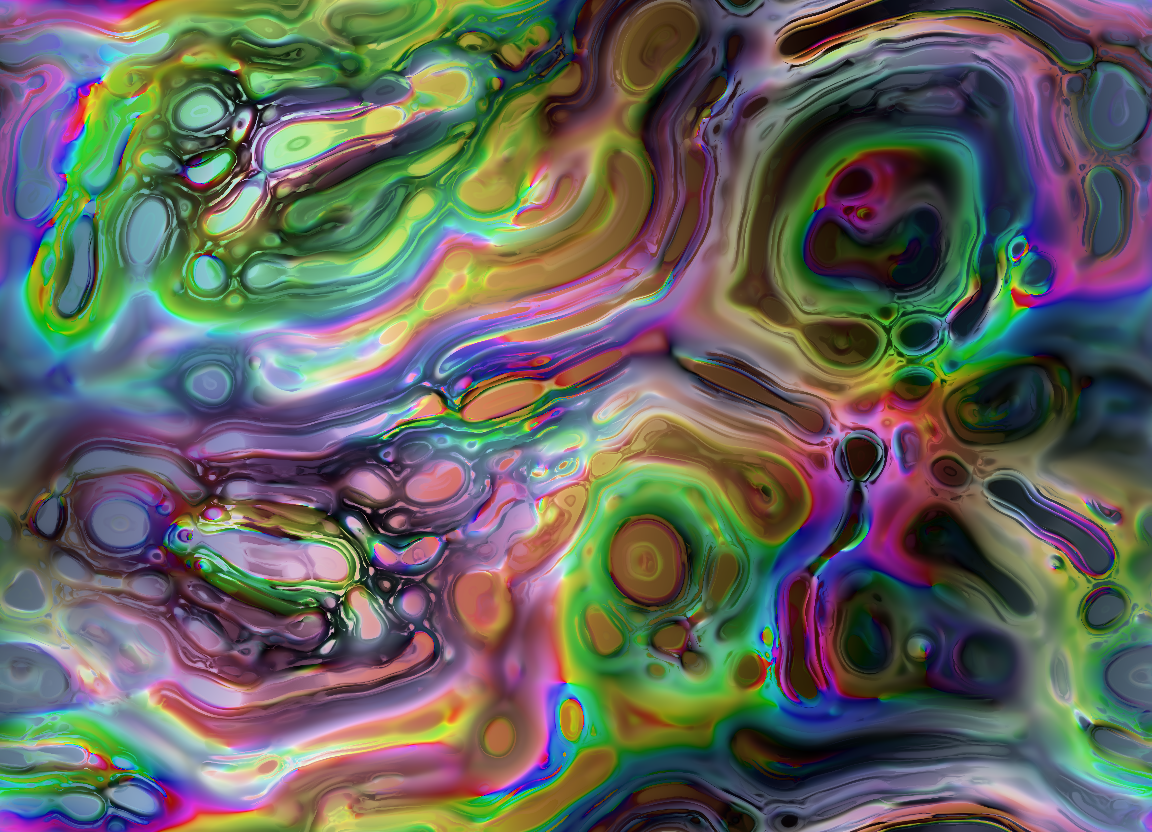
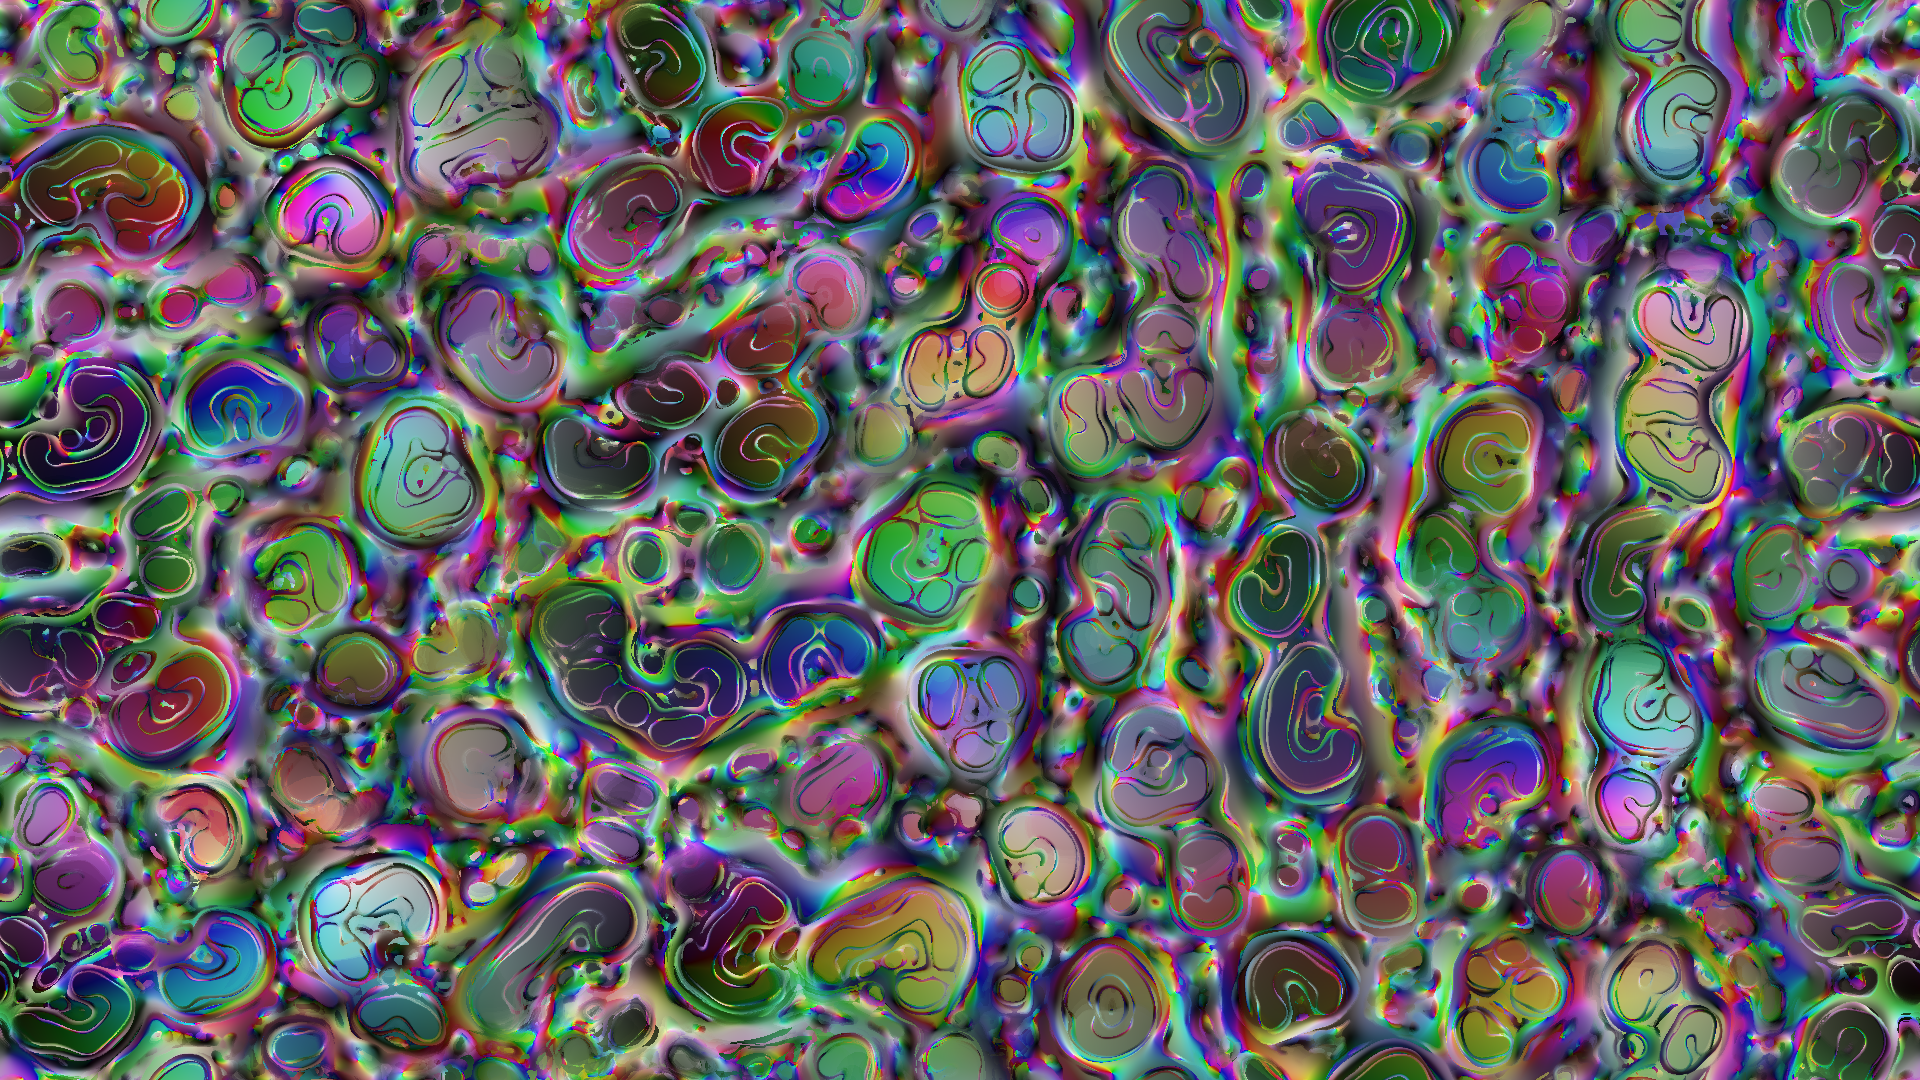
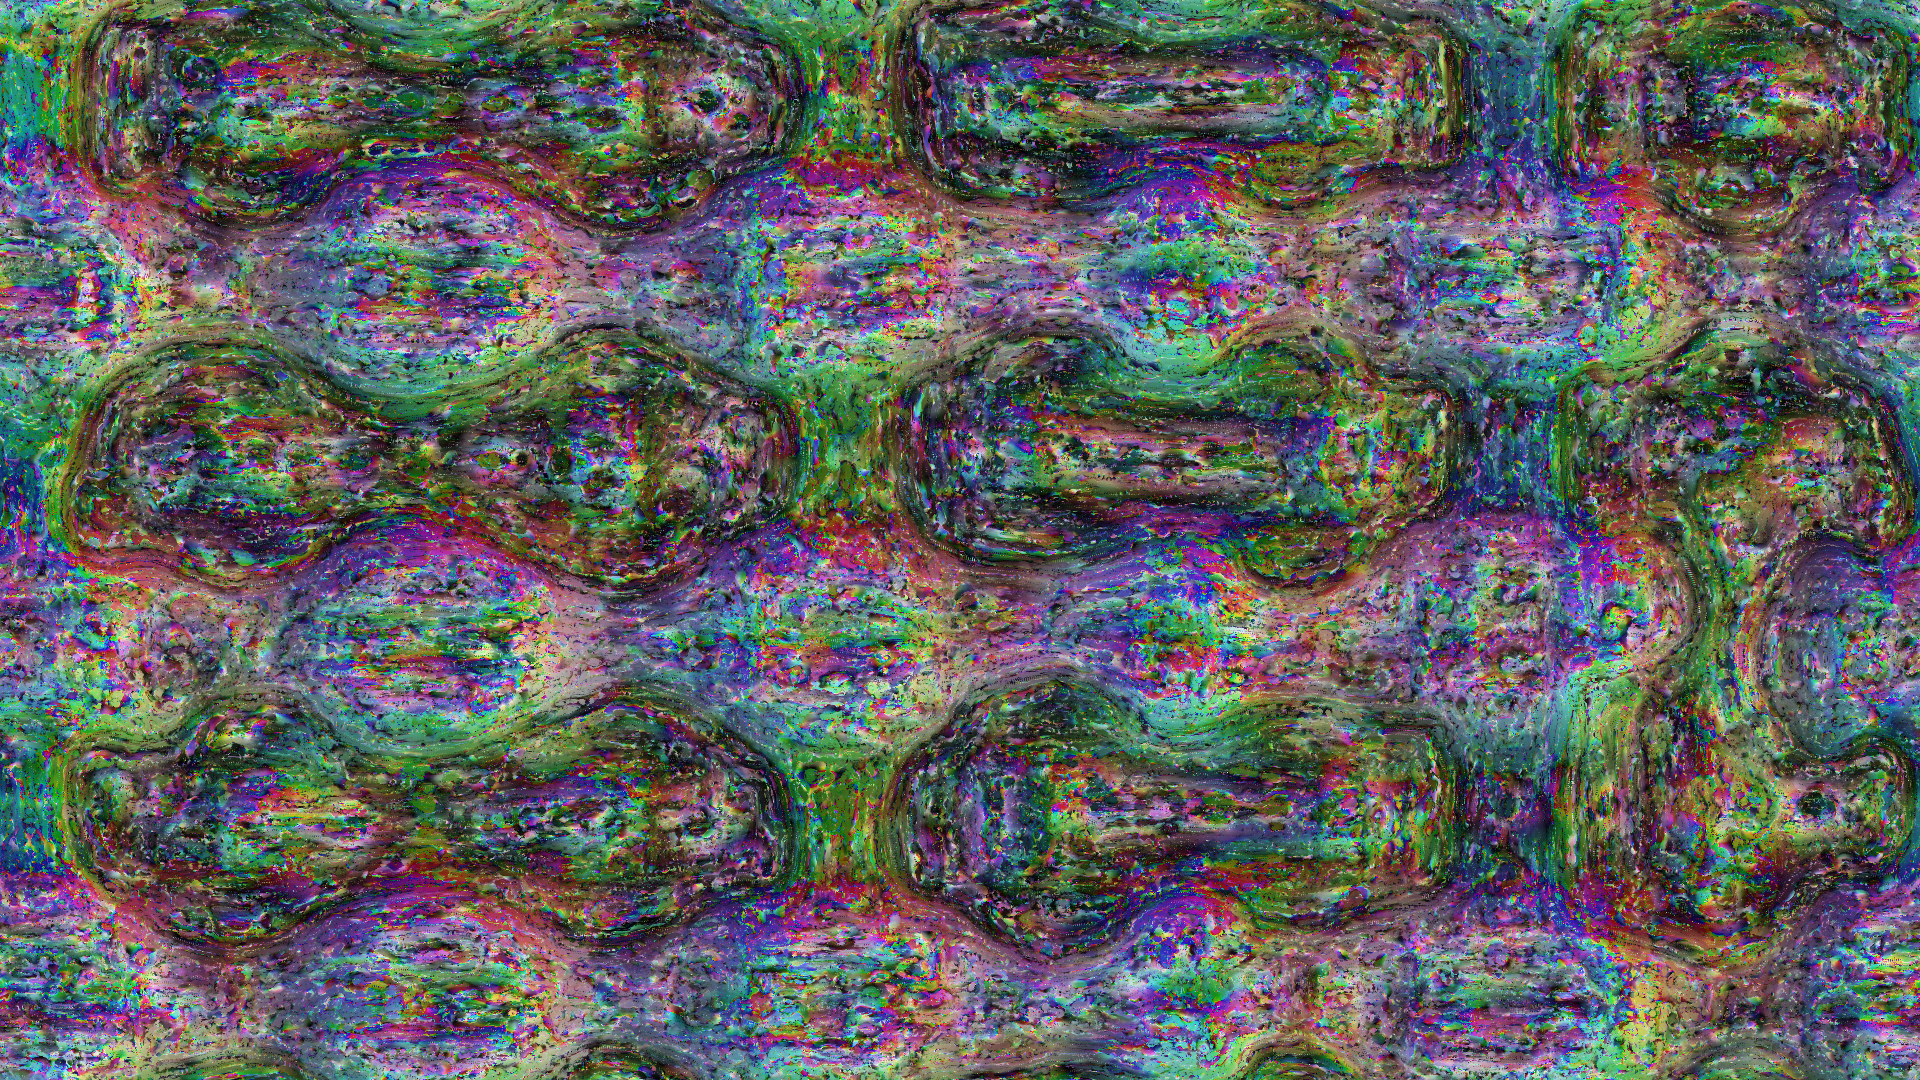
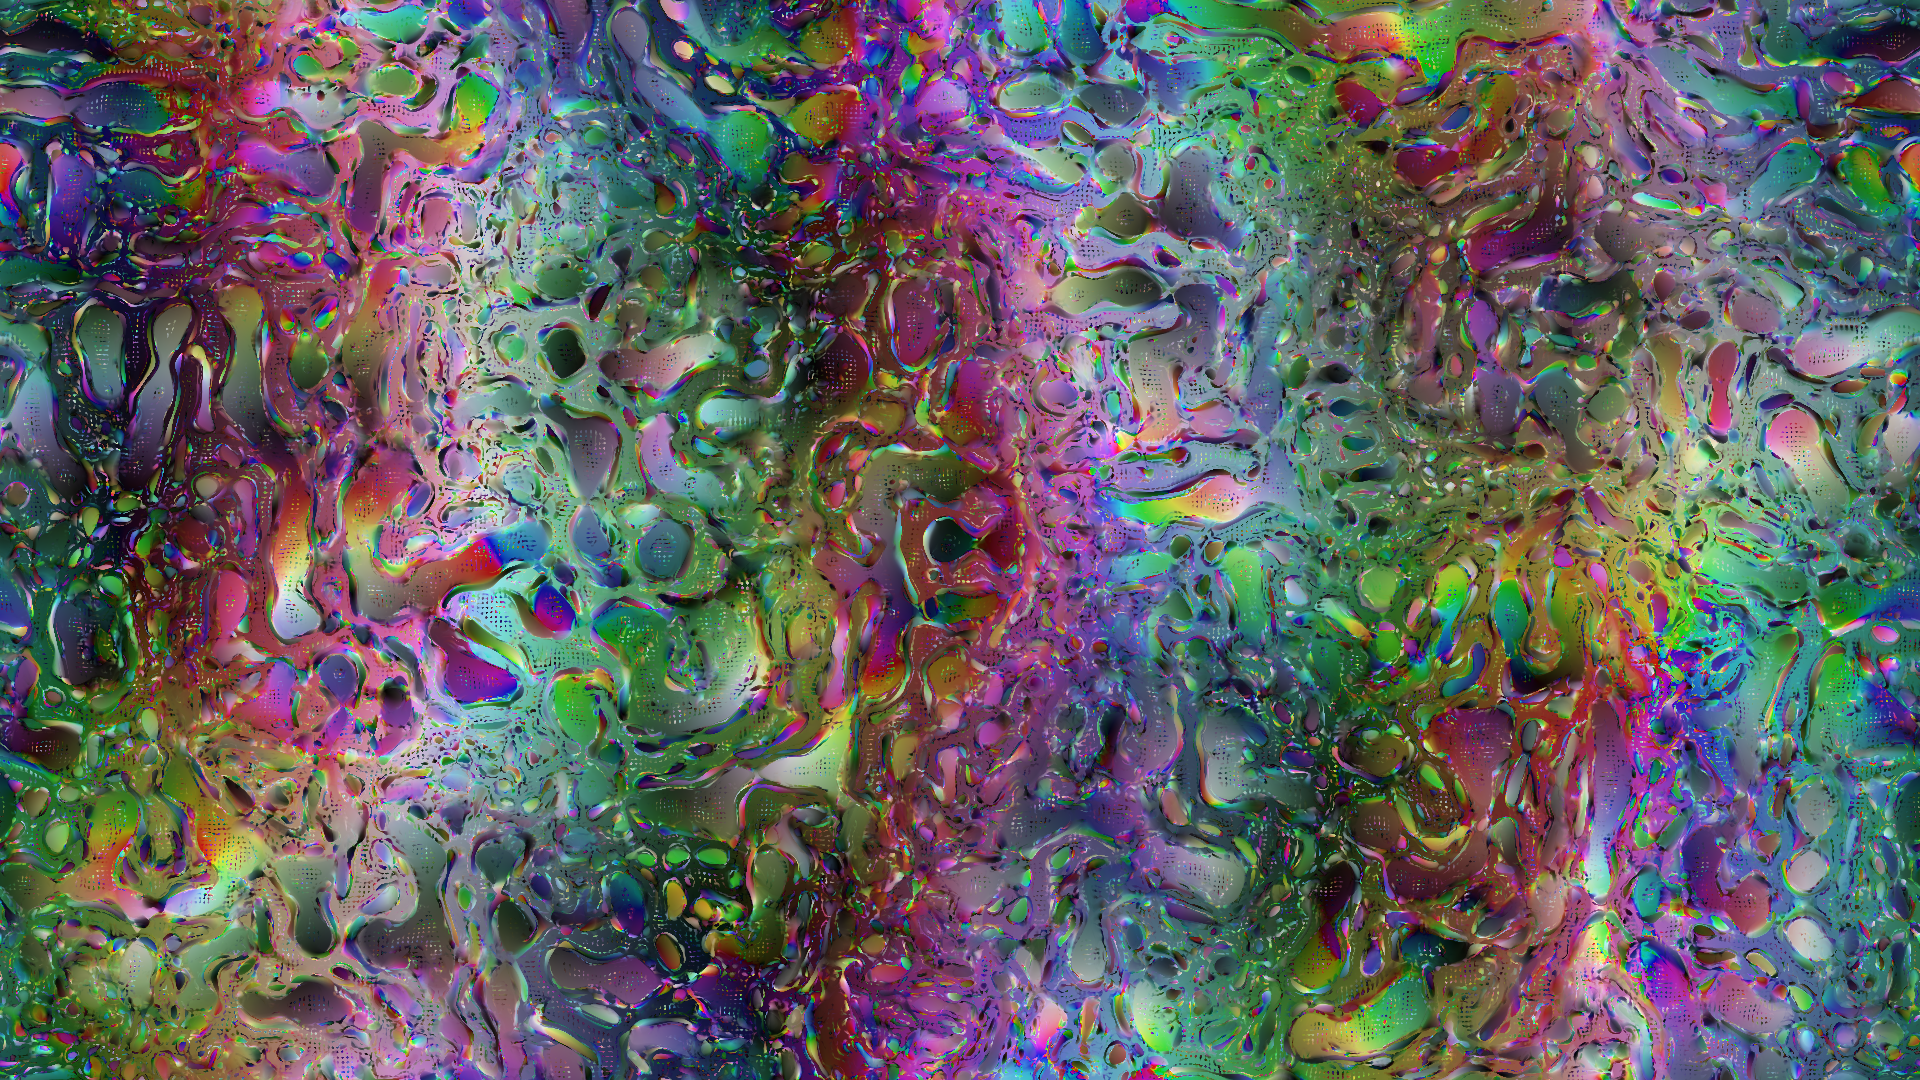
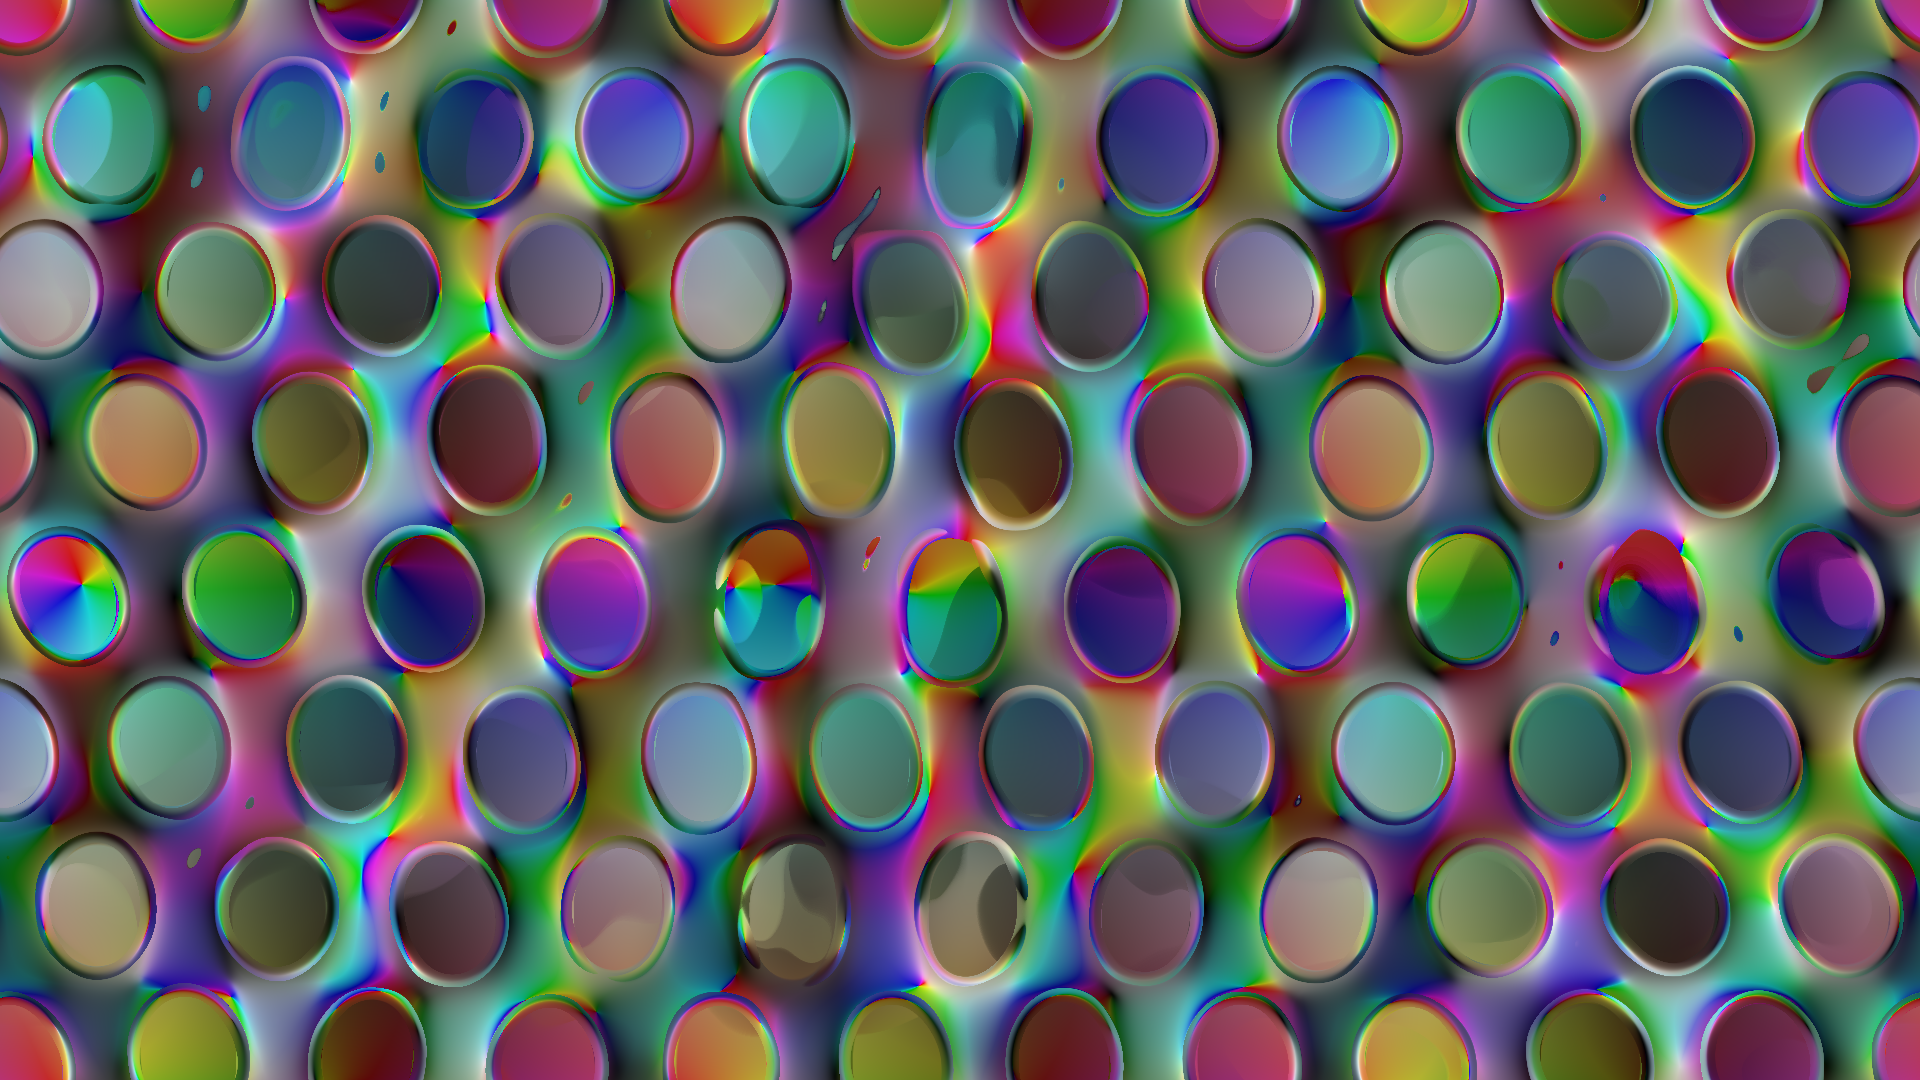
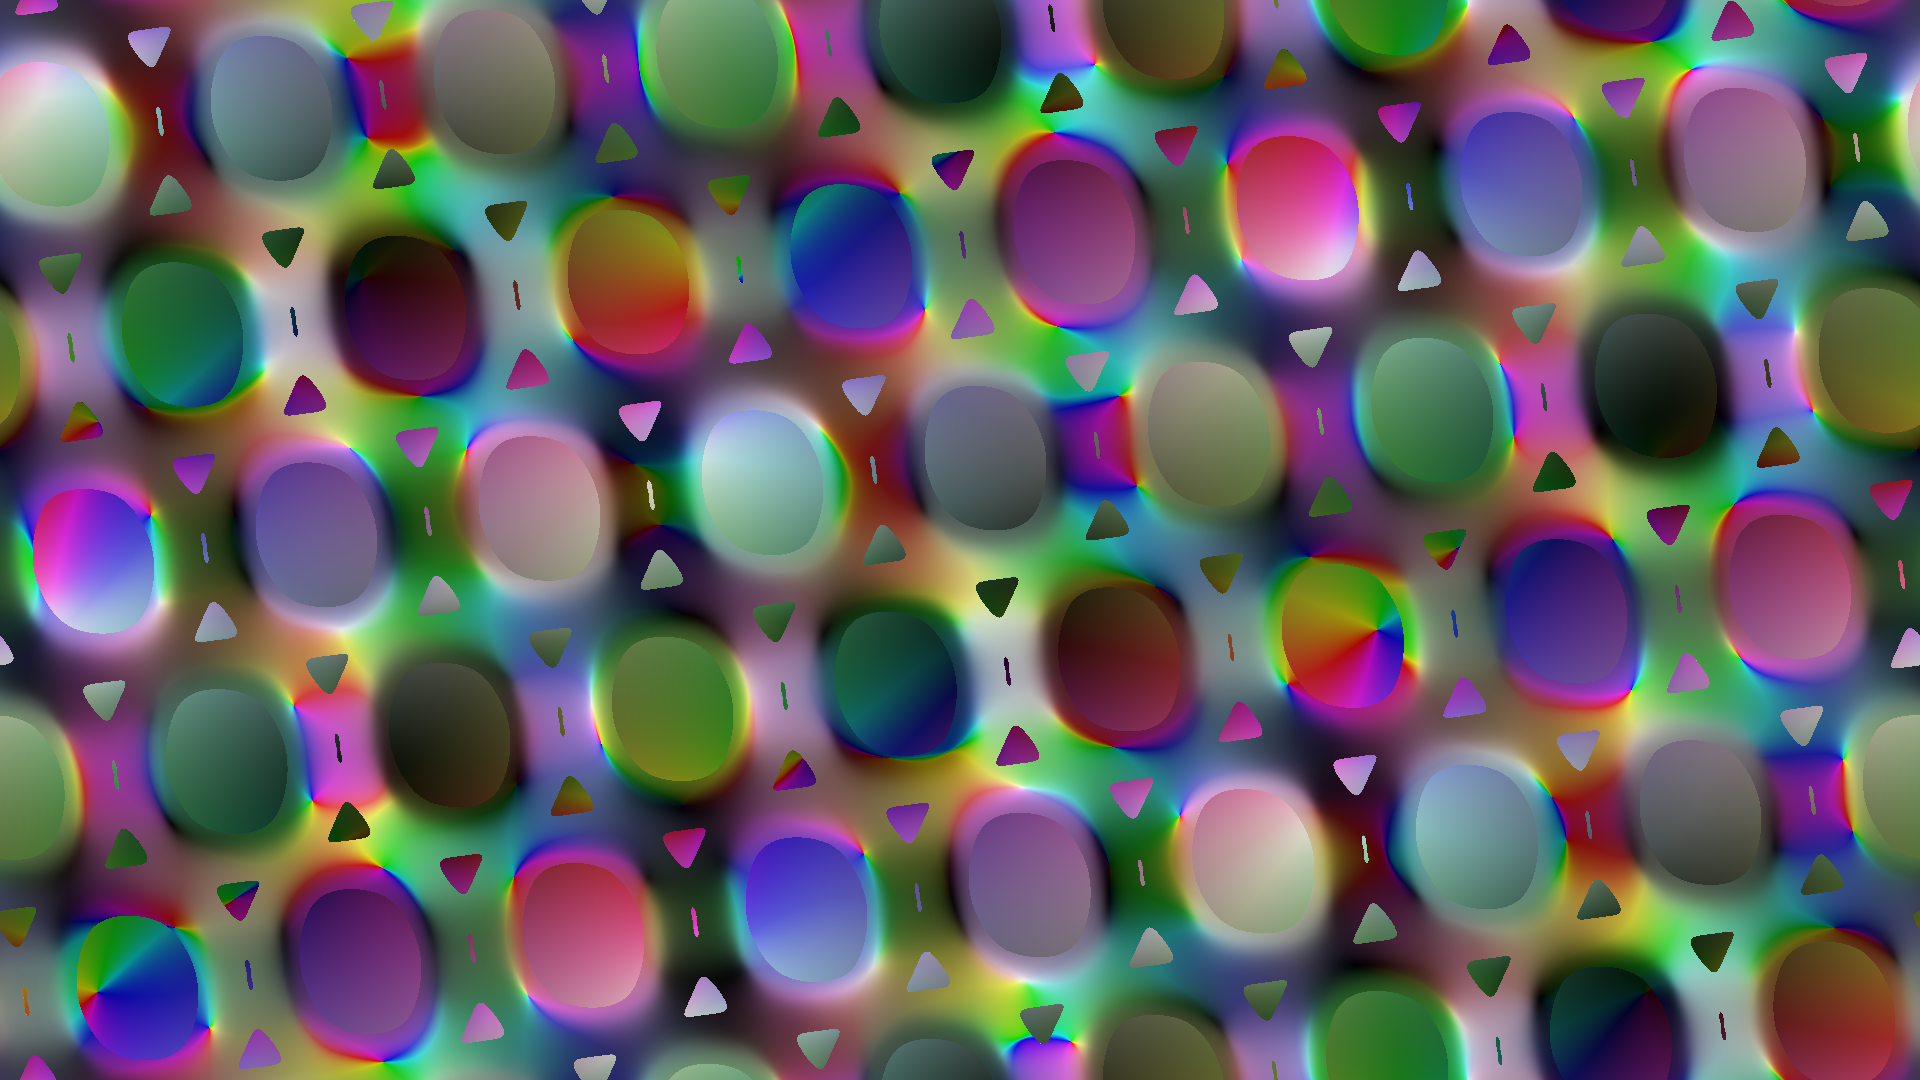
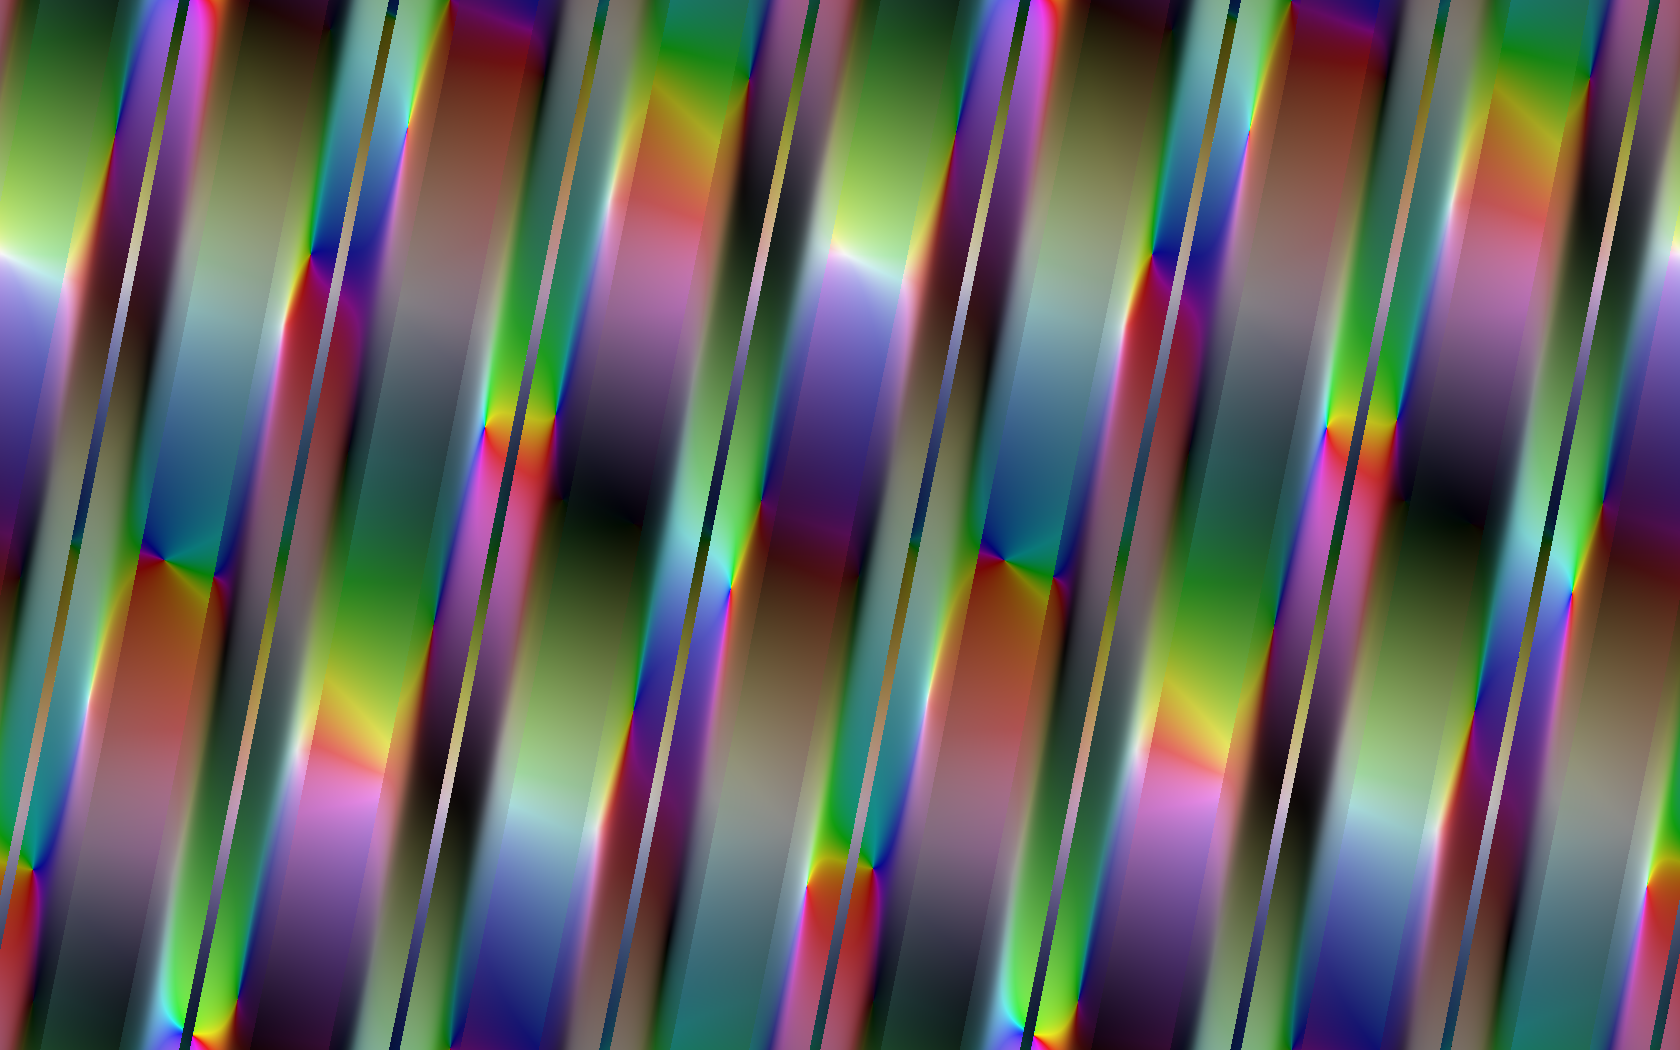
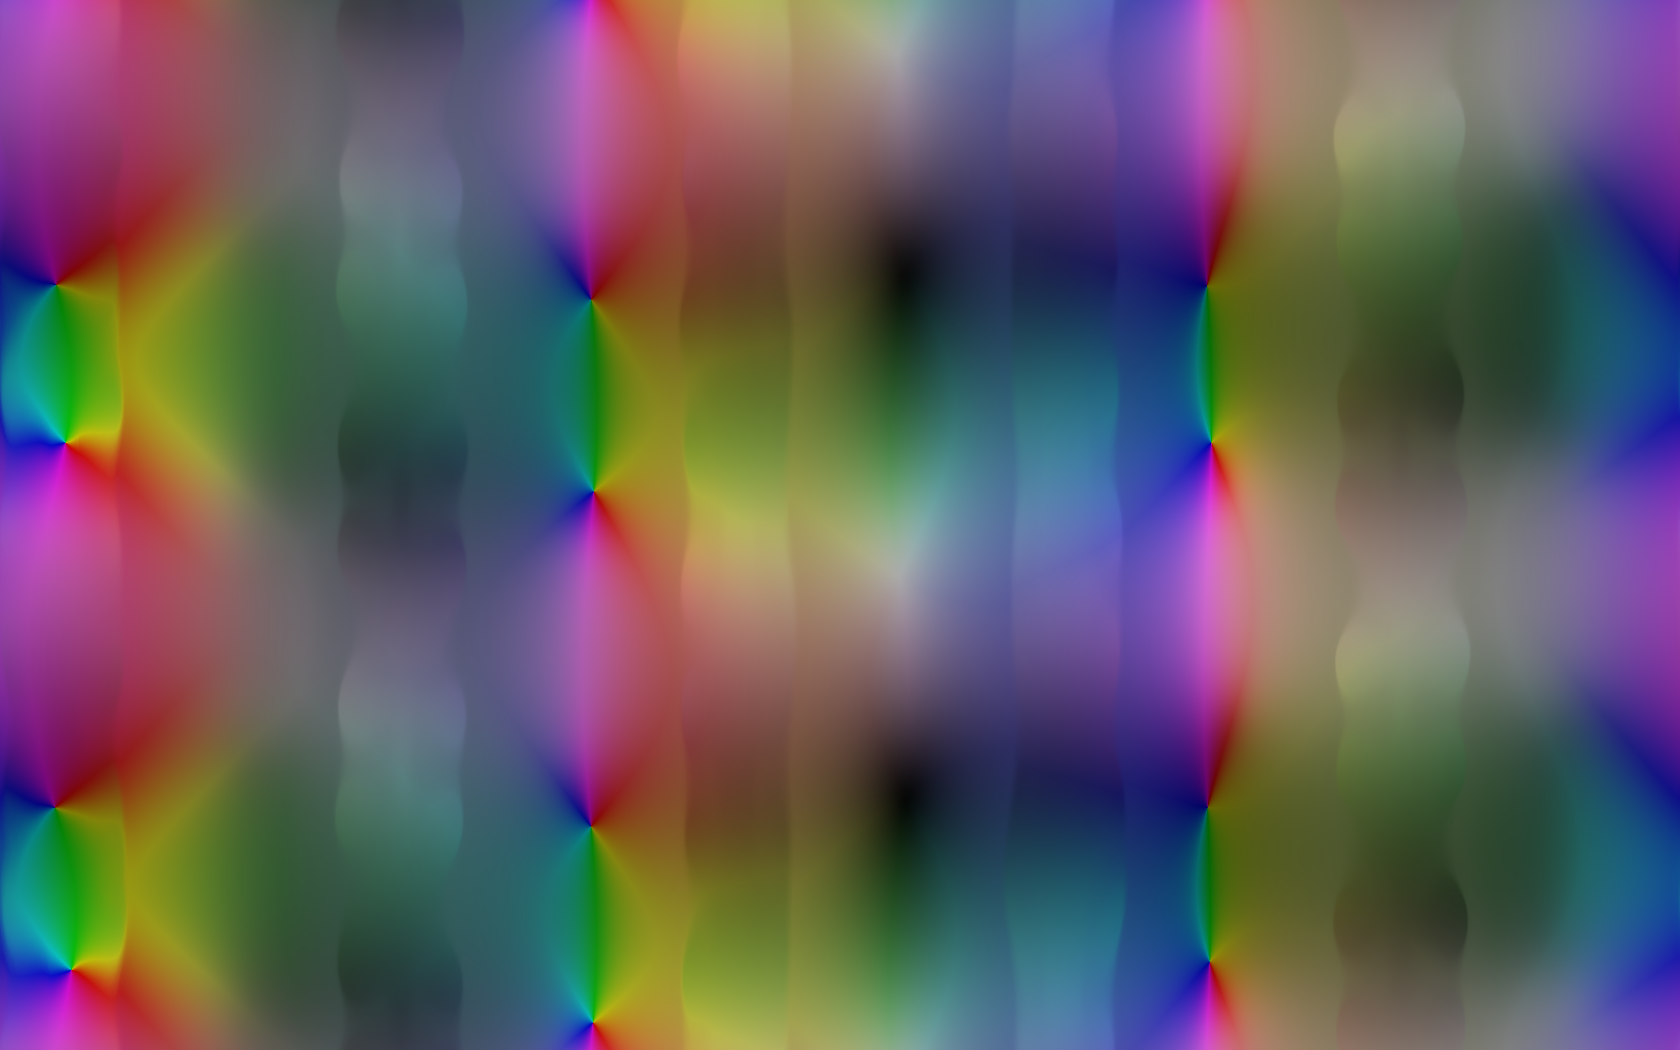
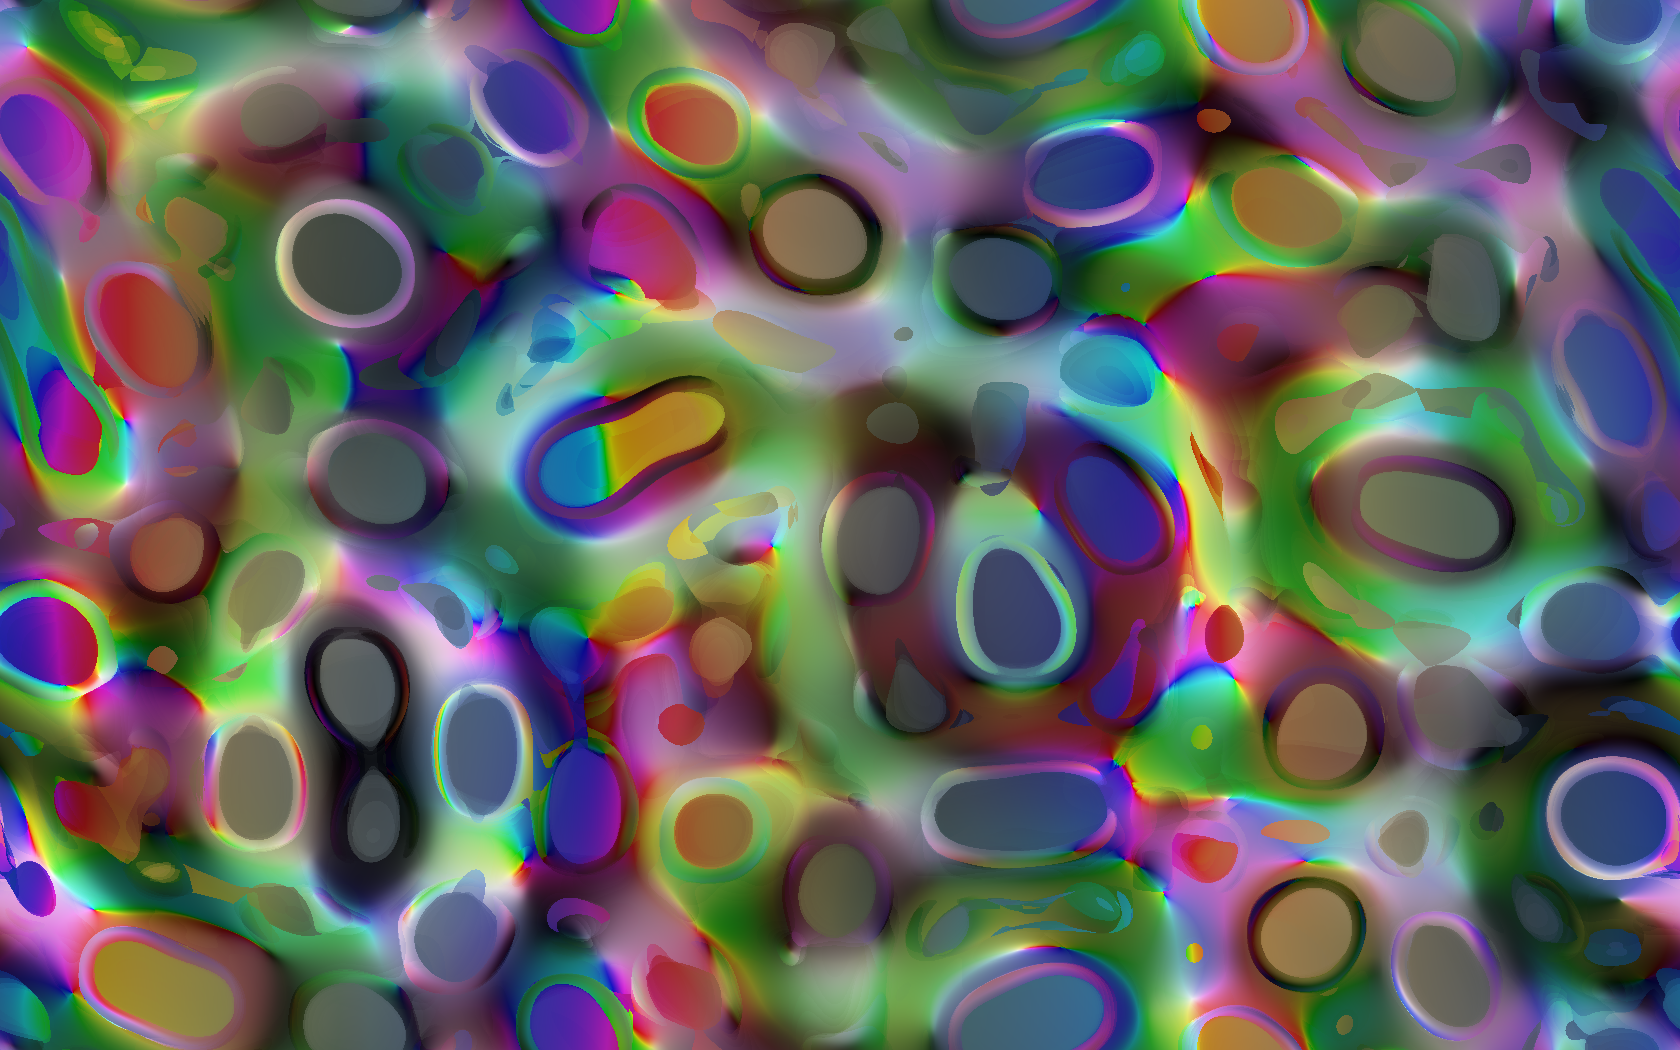
Color rendering
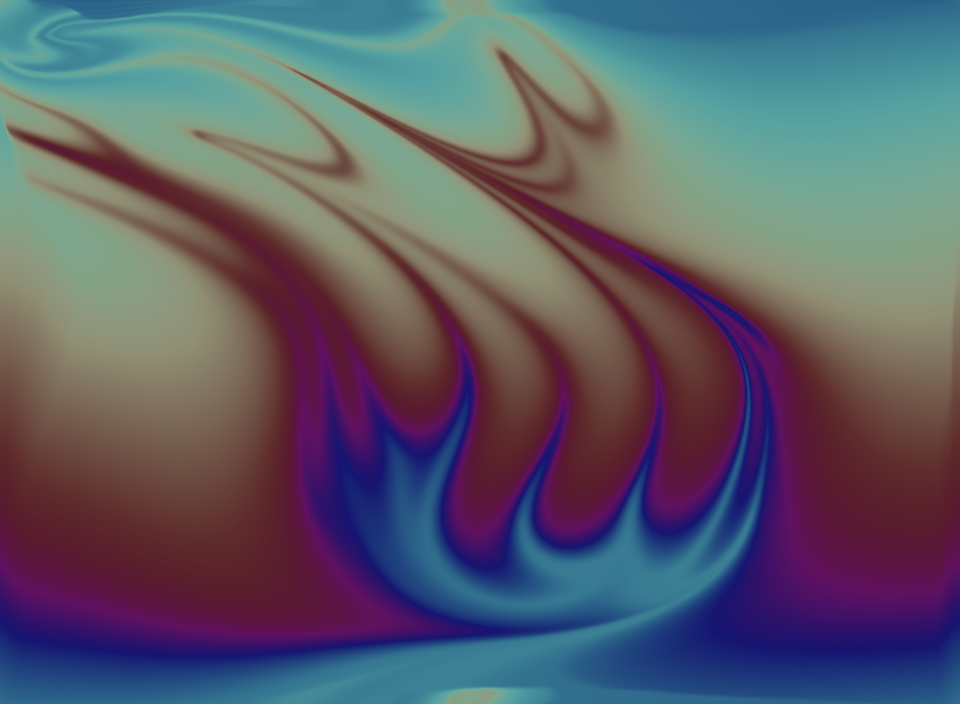
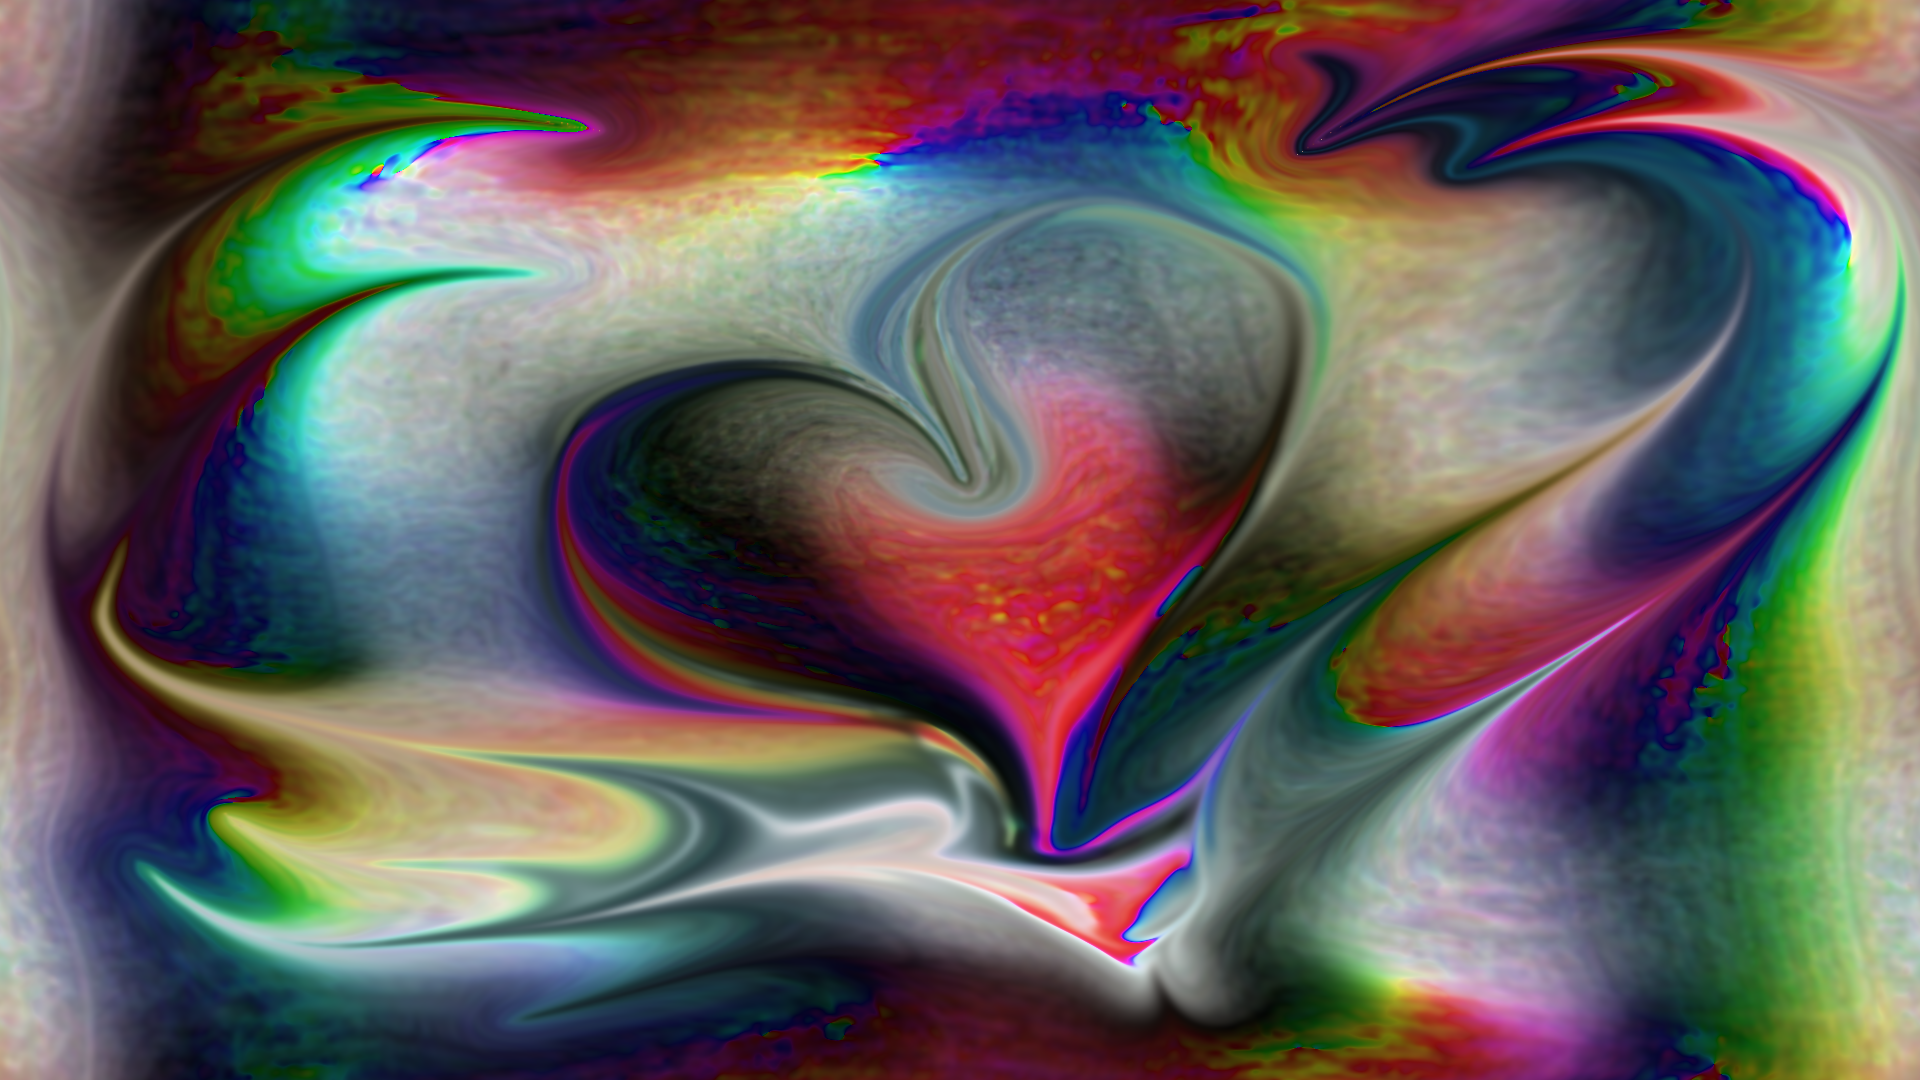
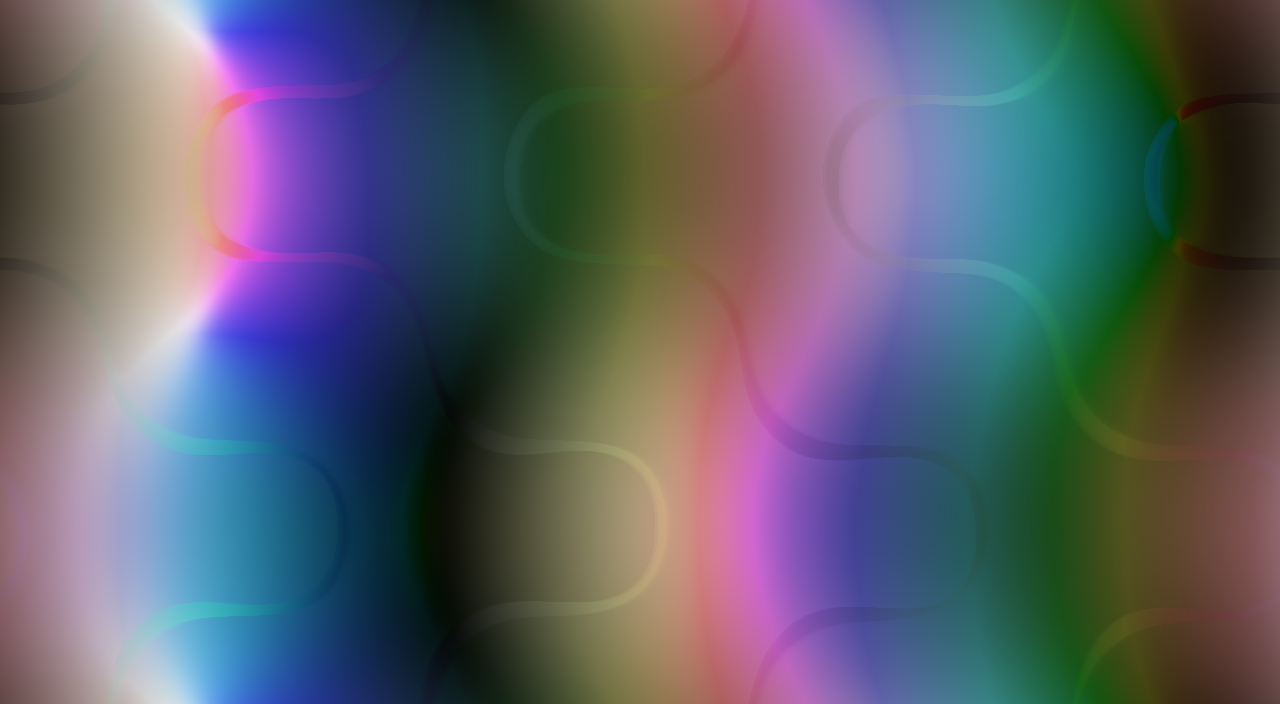
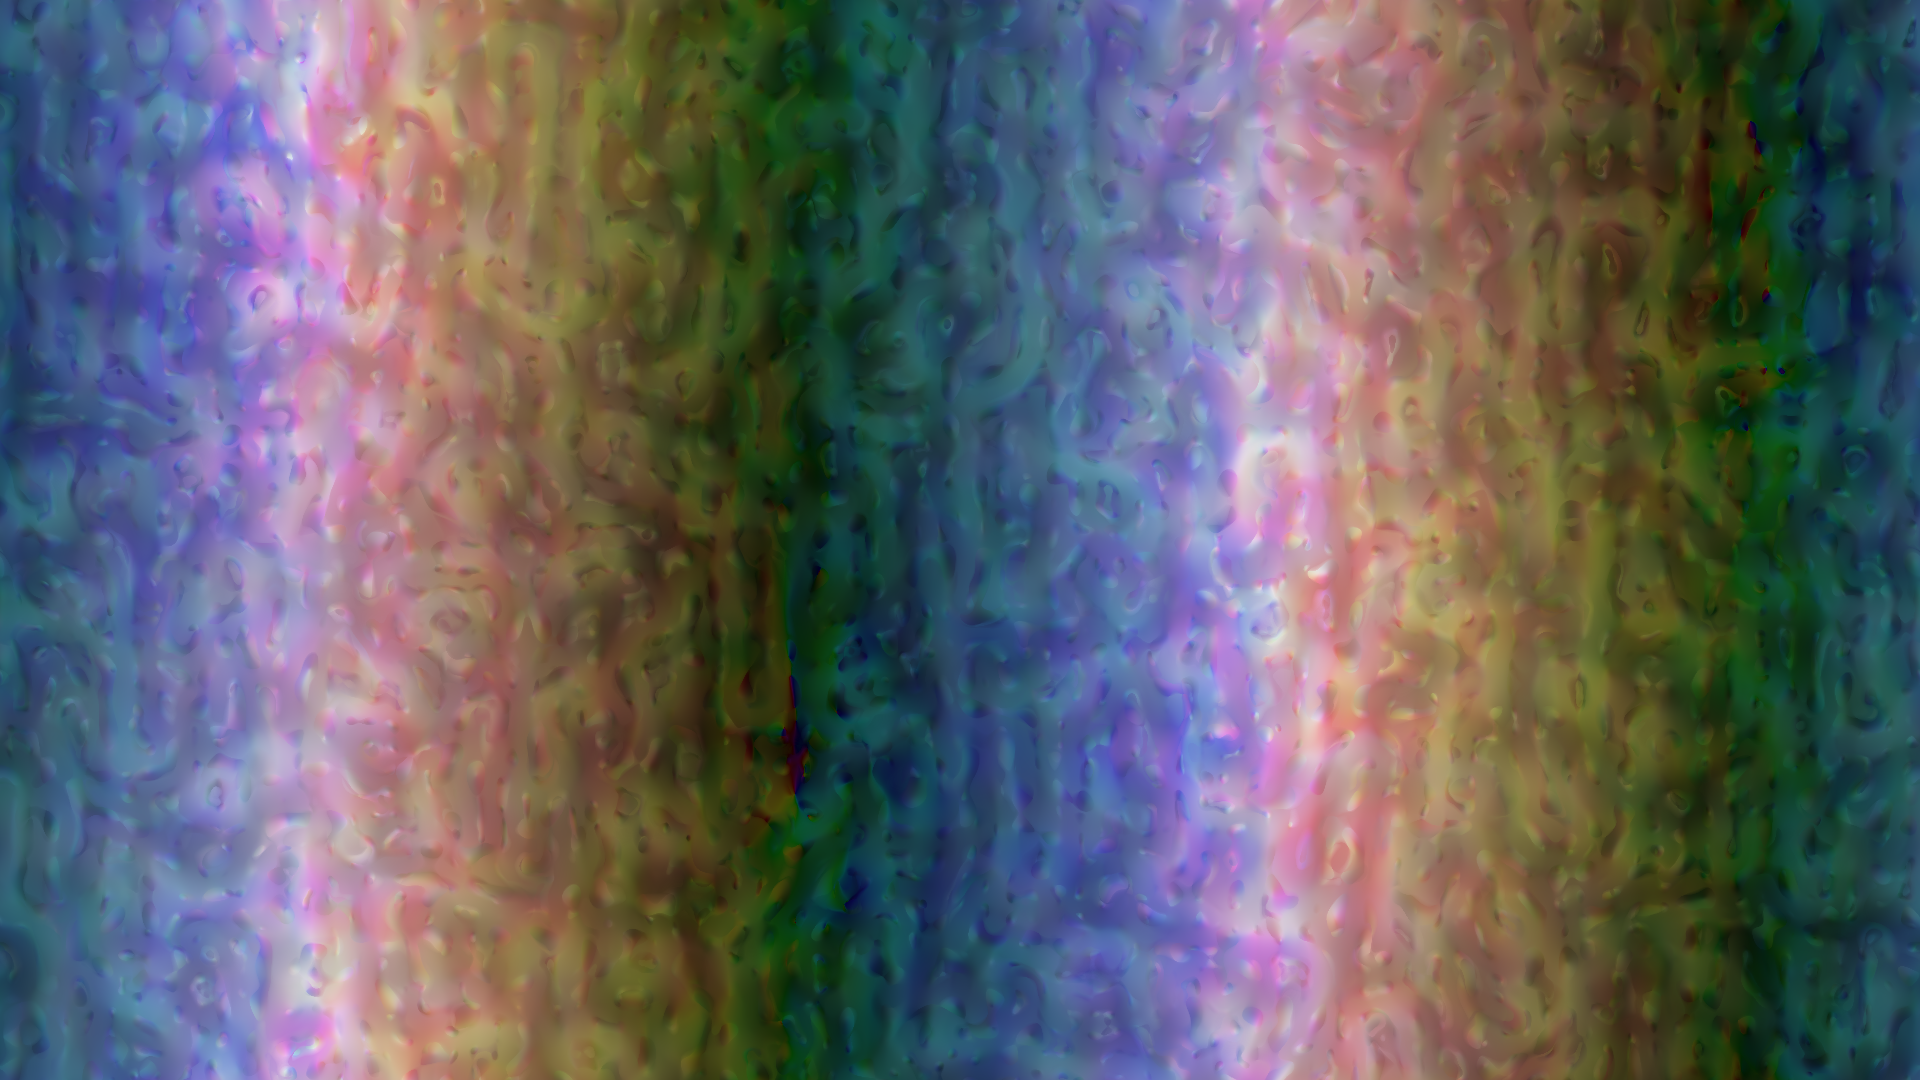
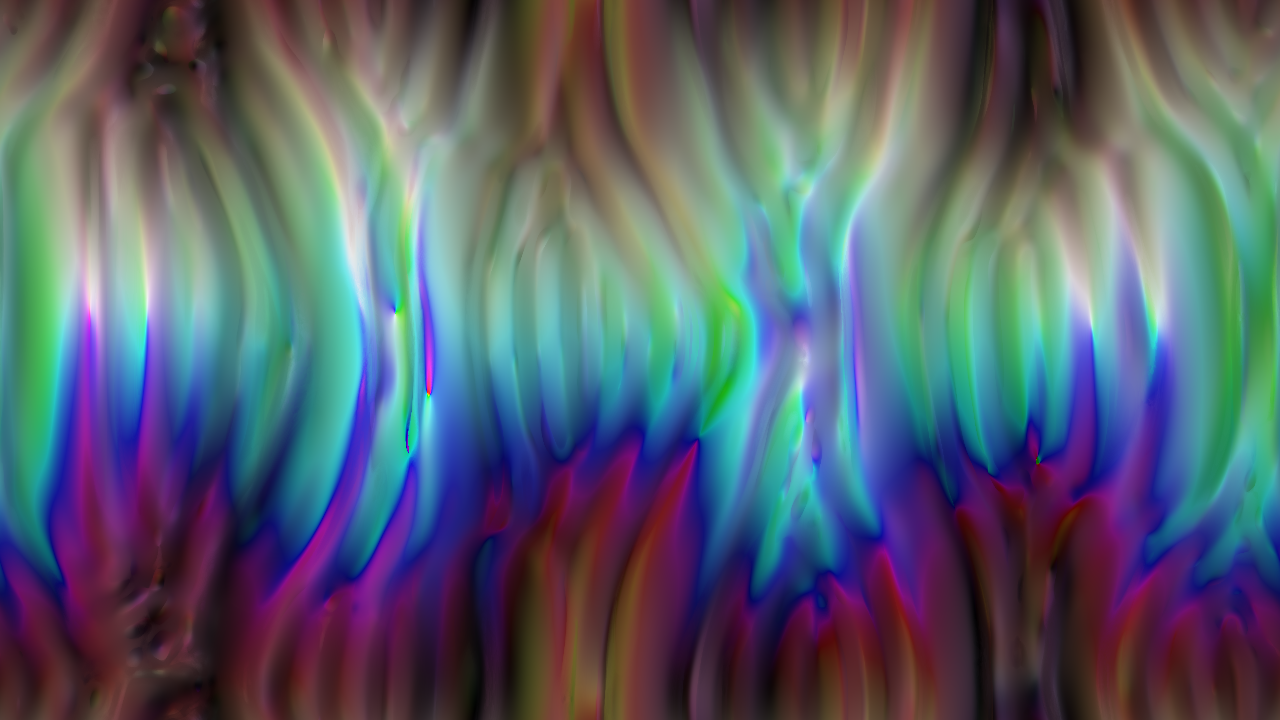
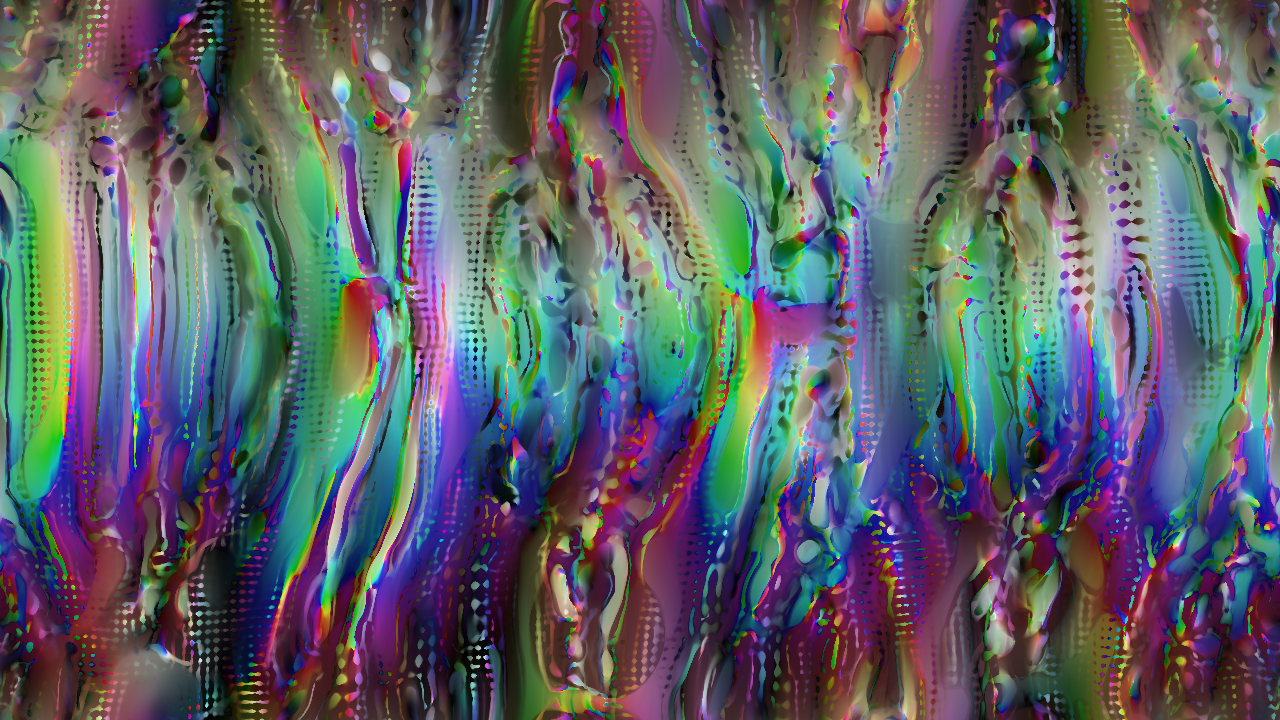
These are all images that evolved from random noise. The only human intervention was parameter selection, and in many cases those were chosen randomly as well. The first image is a fairly standard example of what this system looks like.
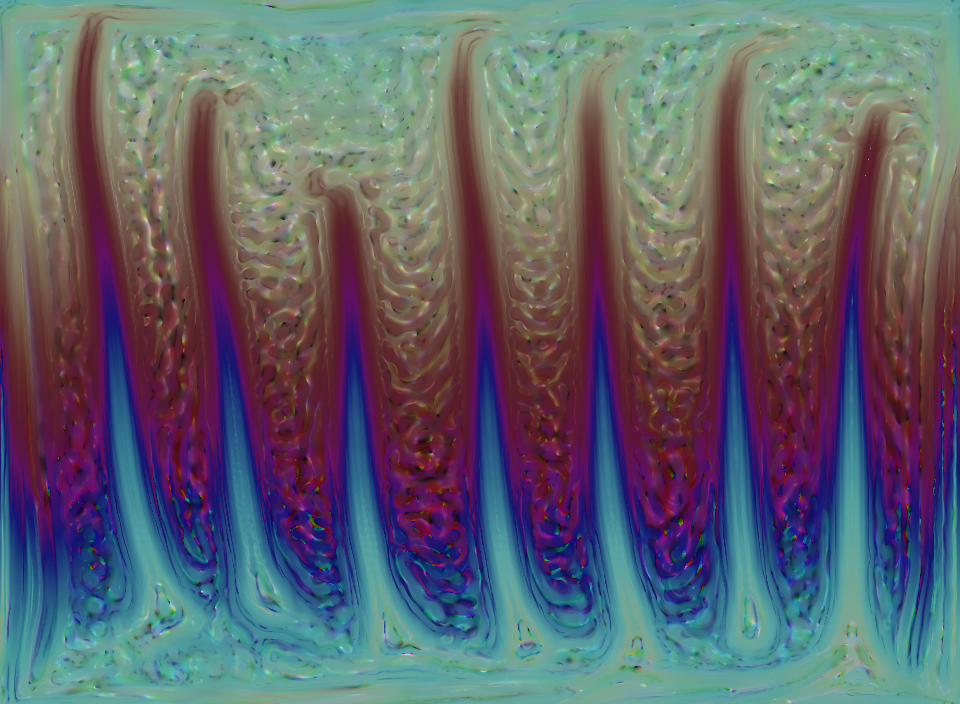
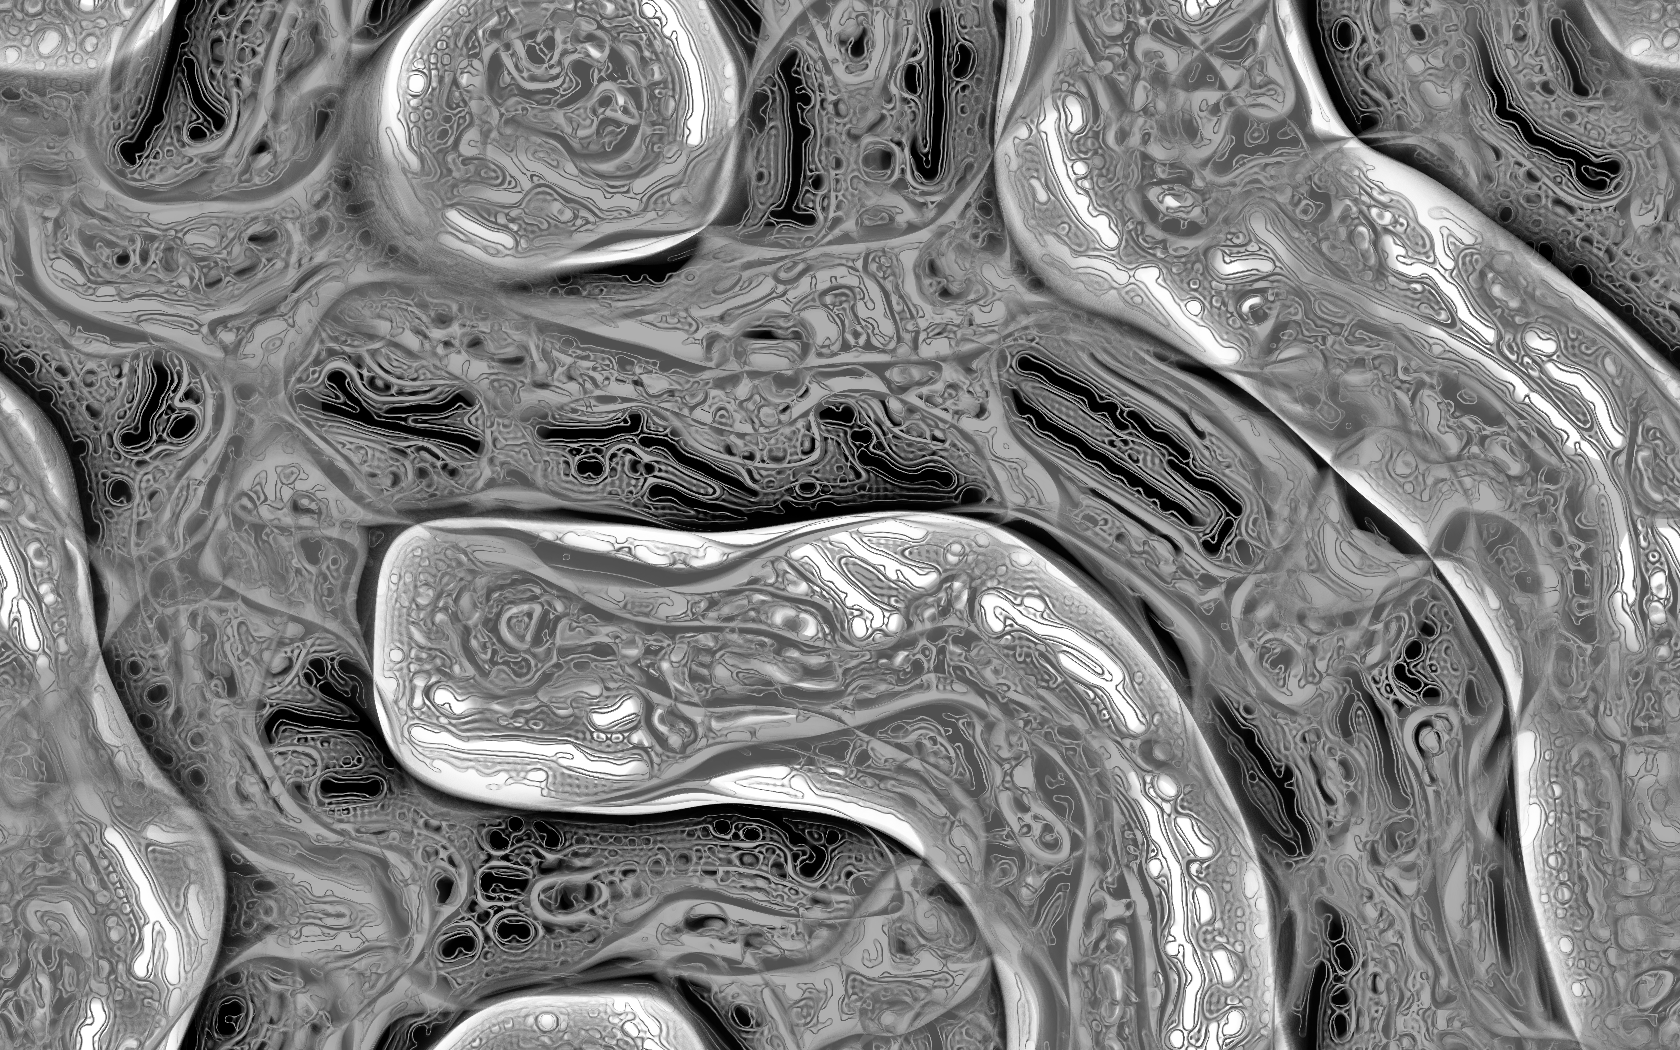
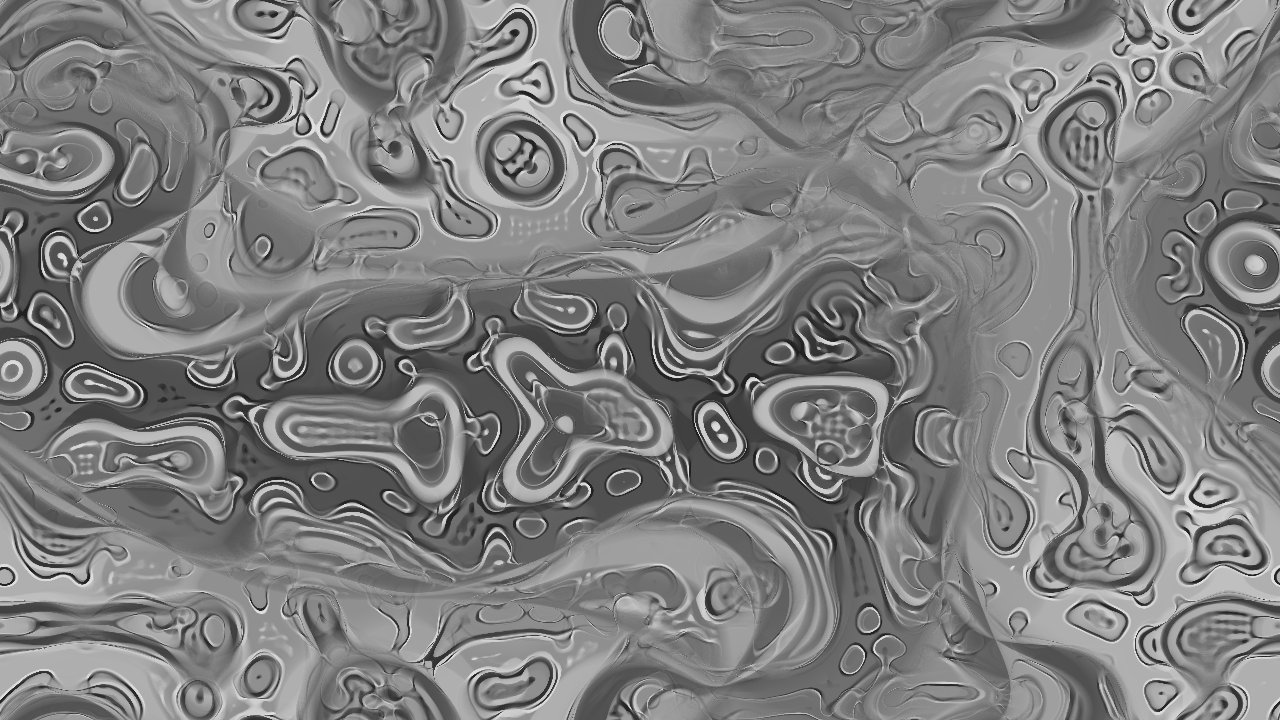
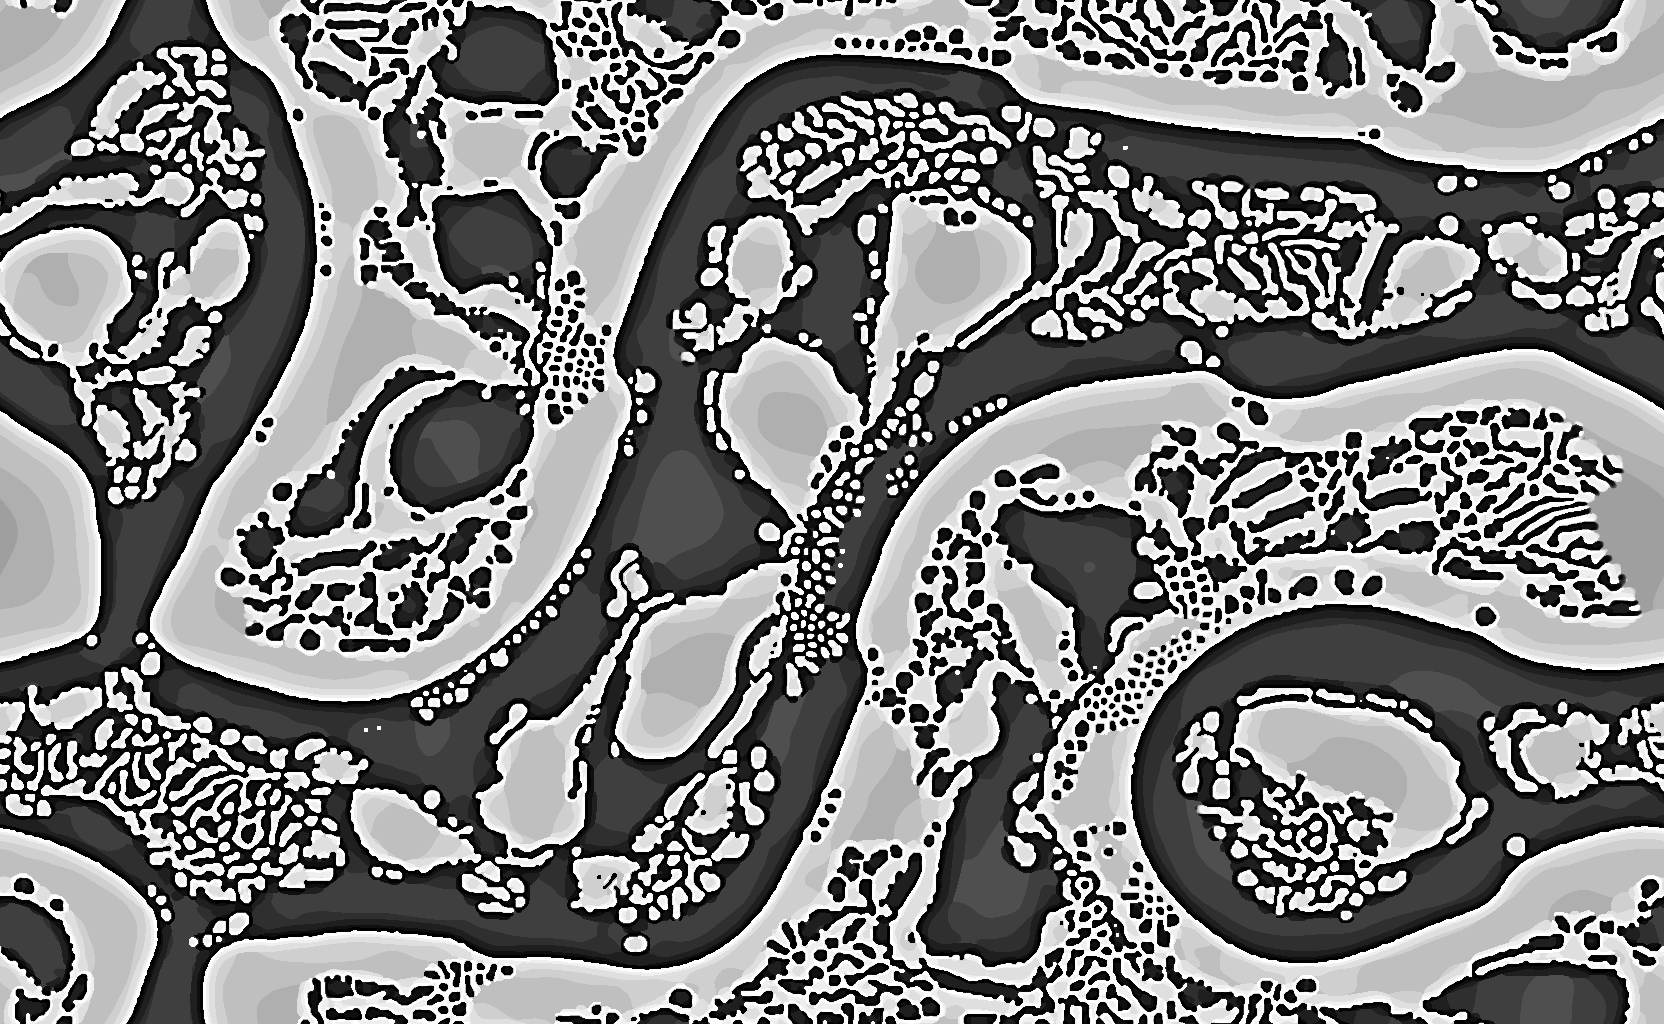
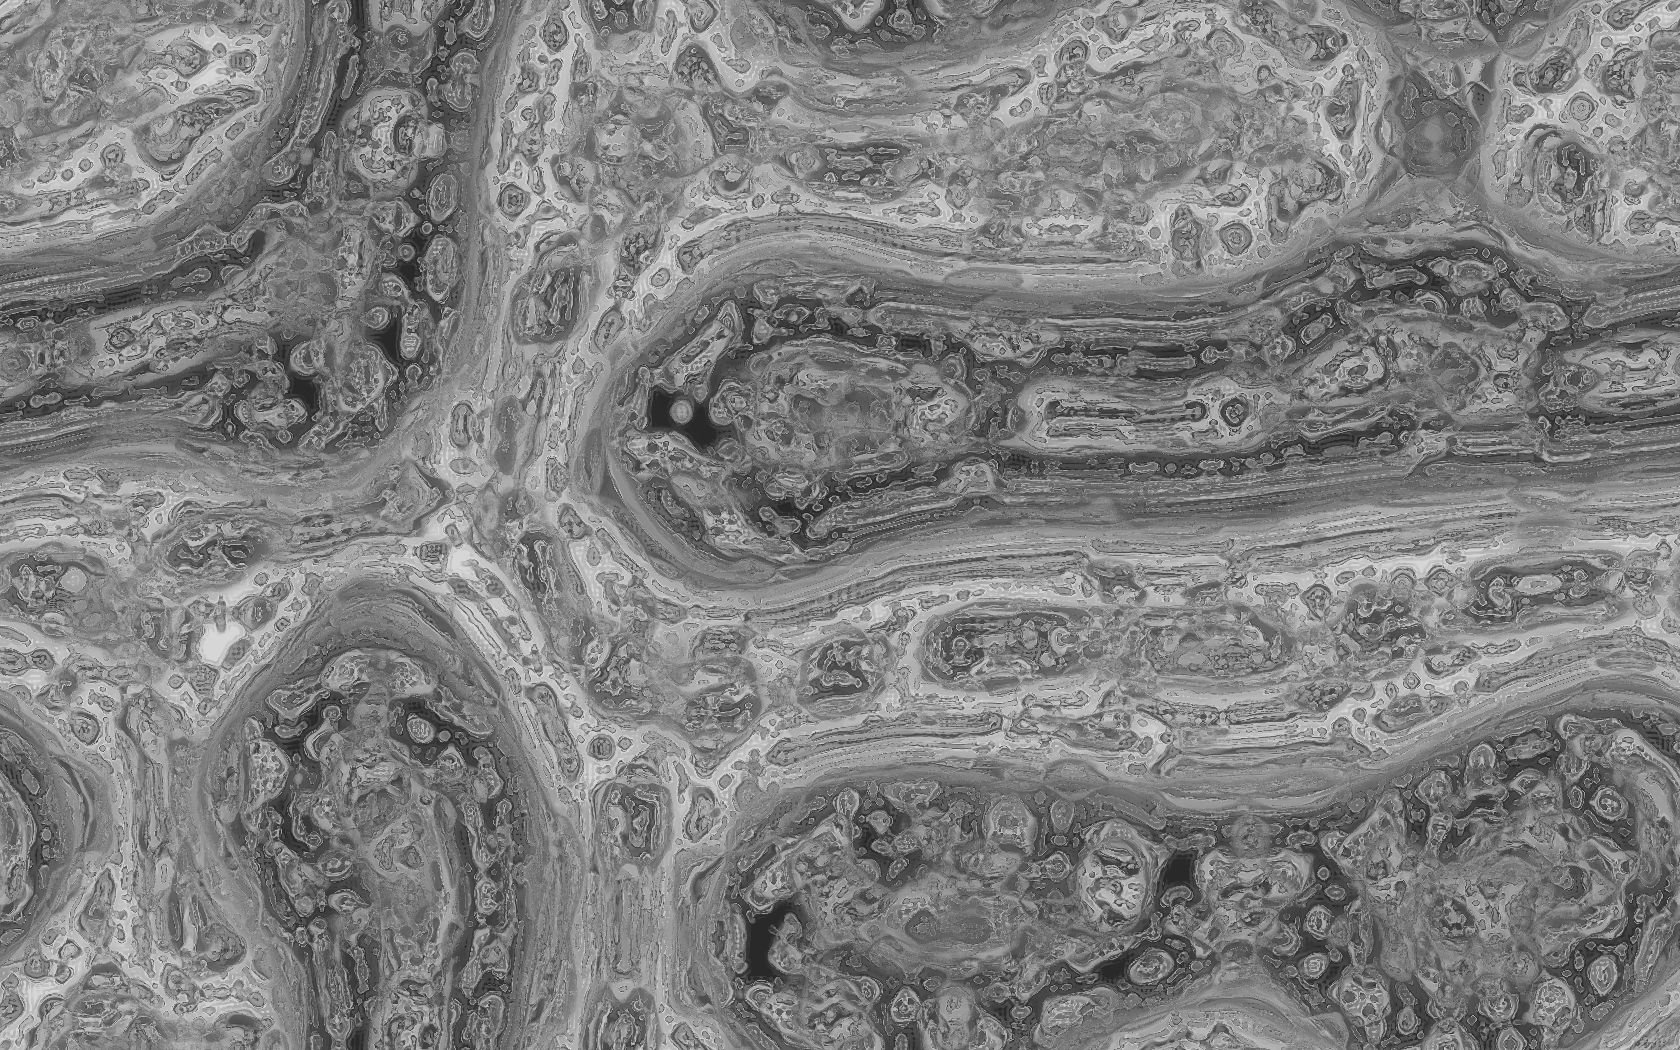
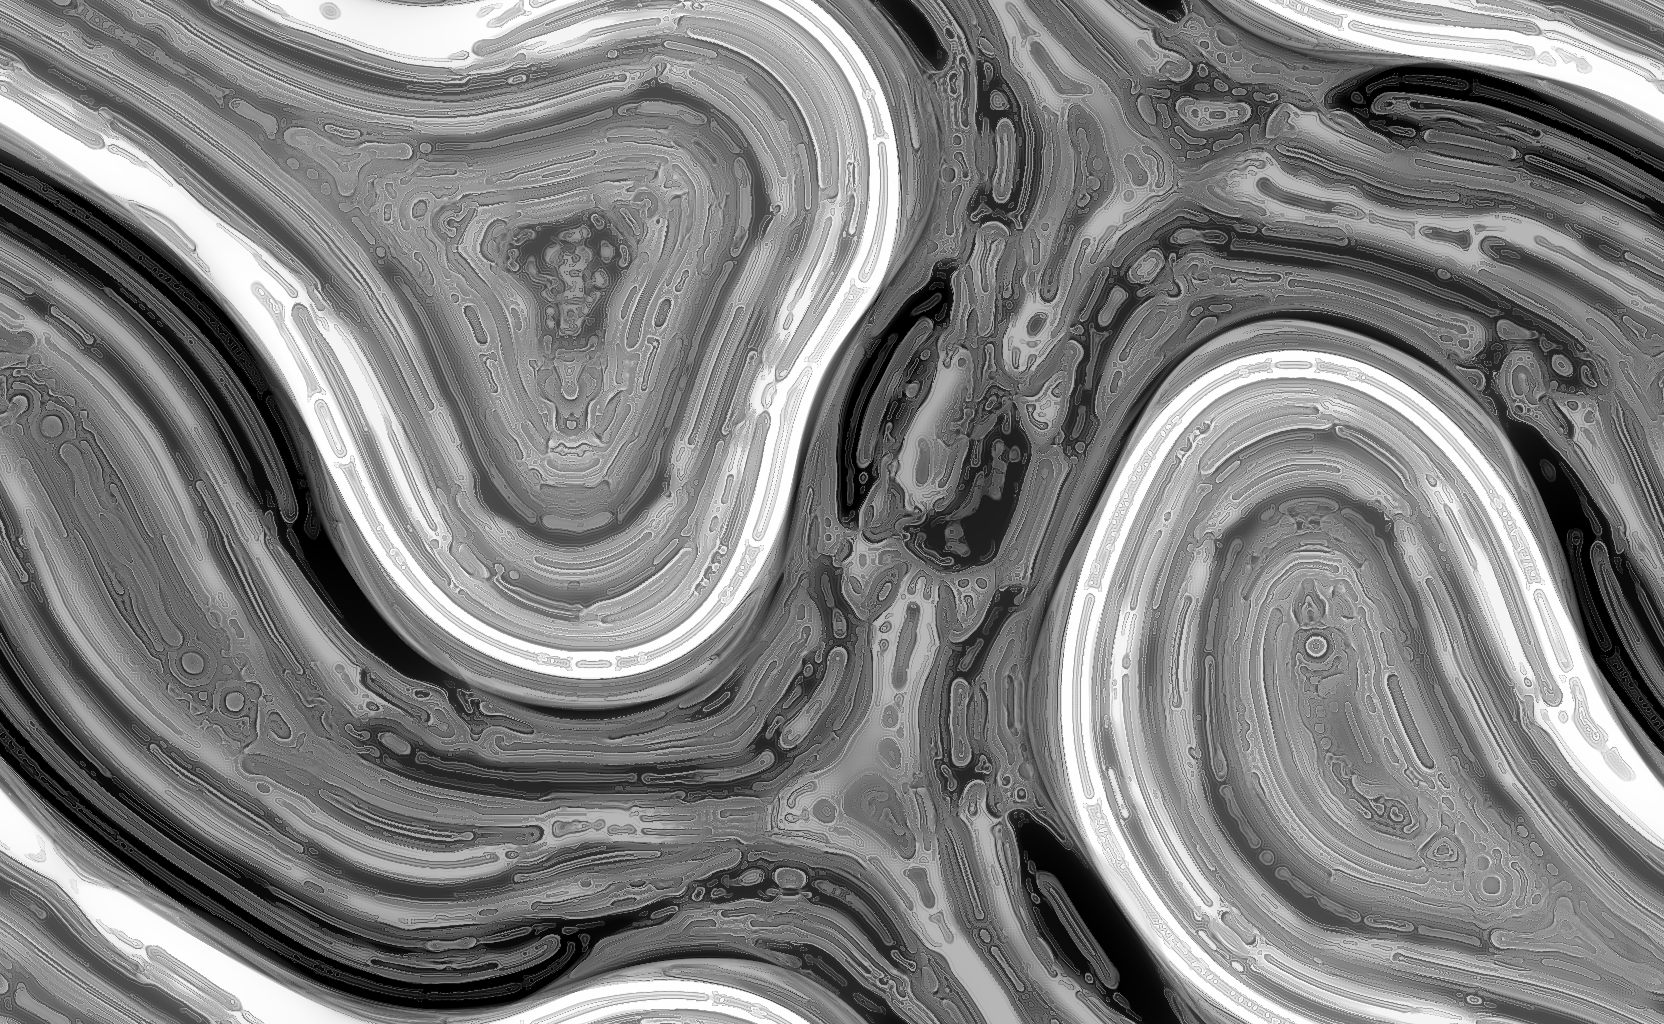
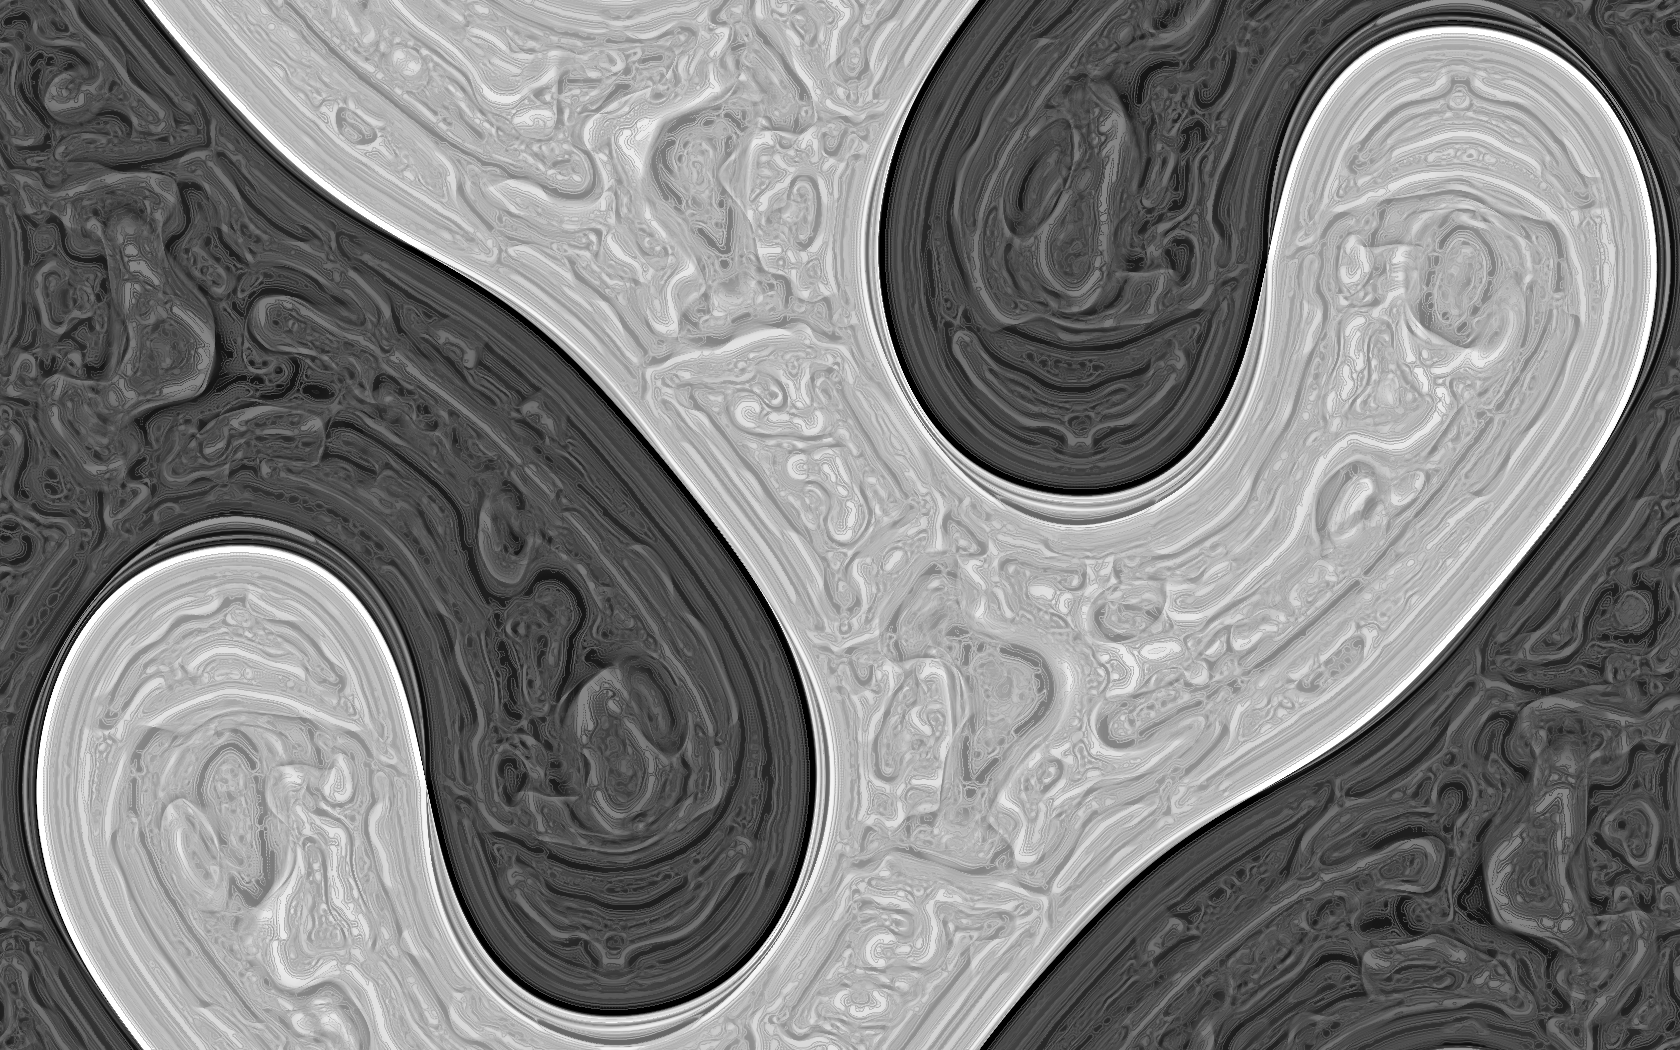
Black-and-white
These are images from rendering Jonathan McCabe’s original (1-D) multiscale Turing pattern. The first image is a fairly standard example of what that system looks like.
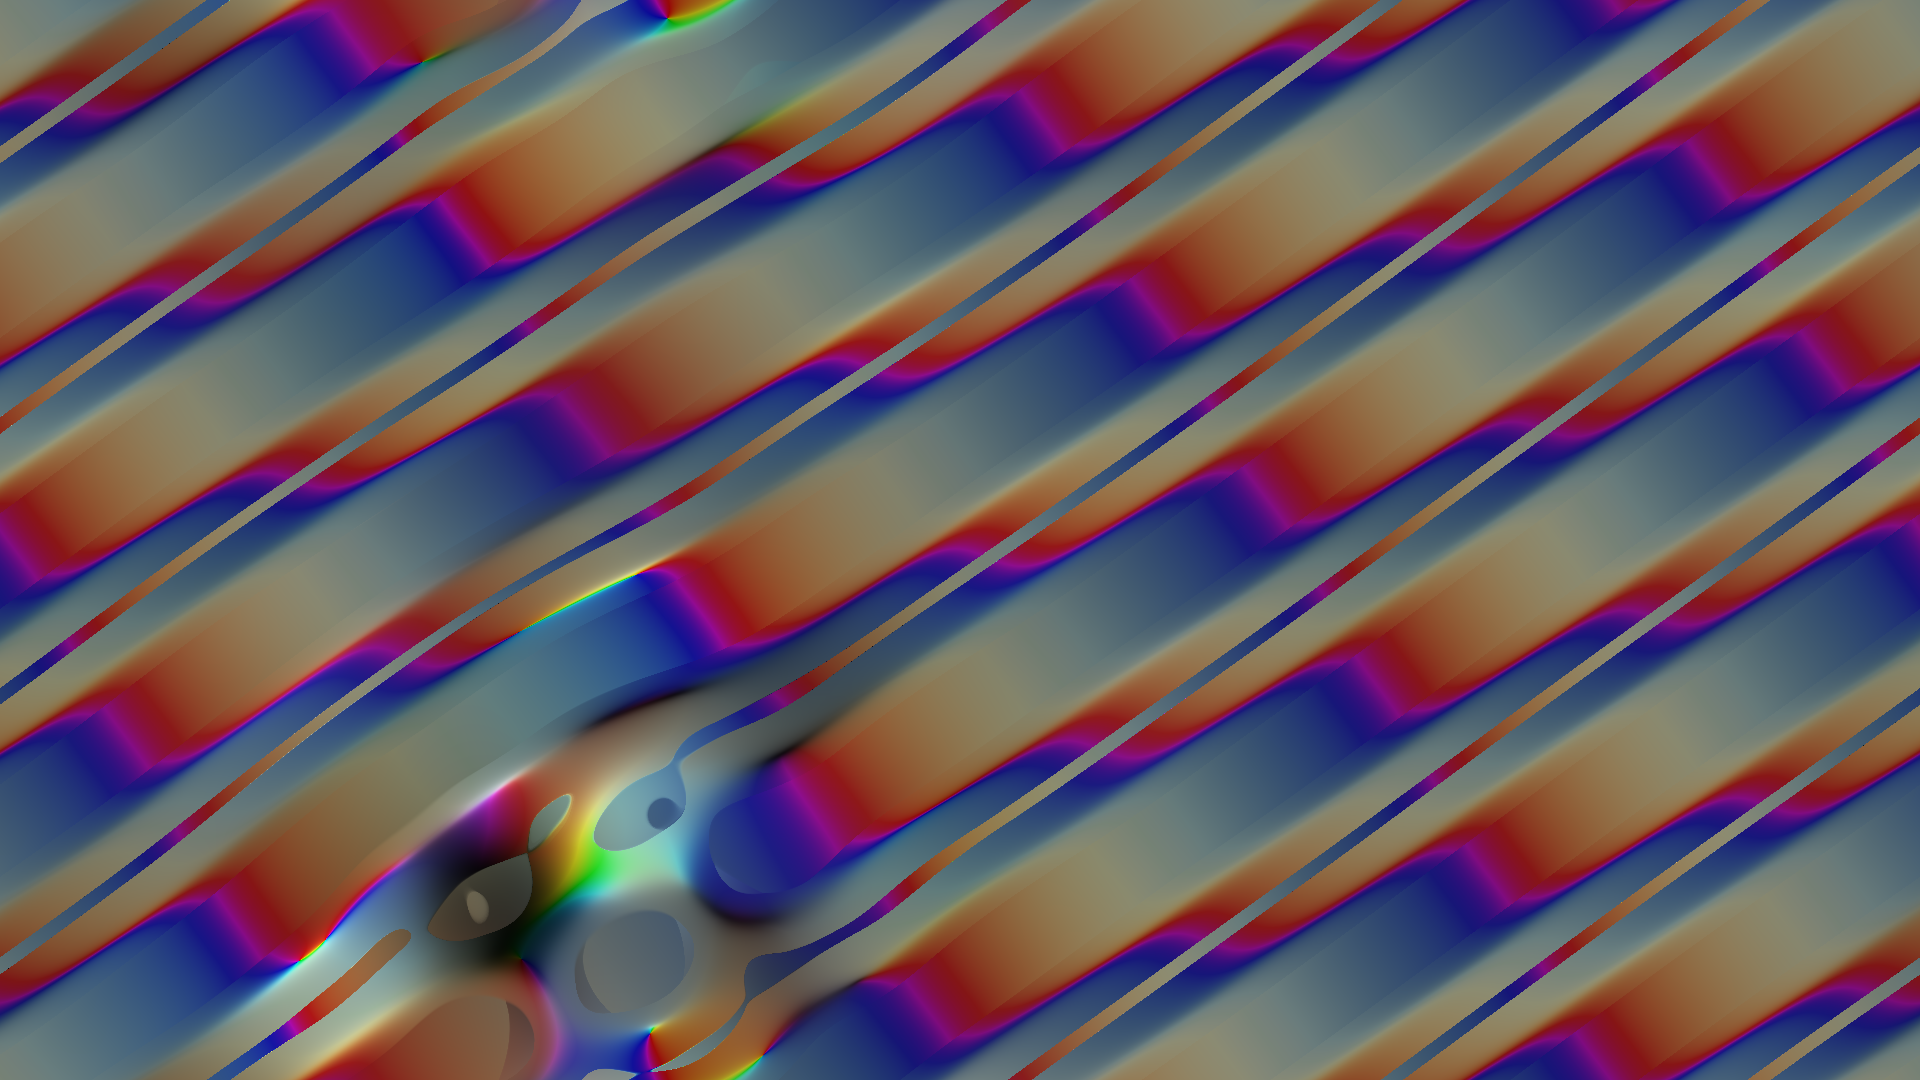
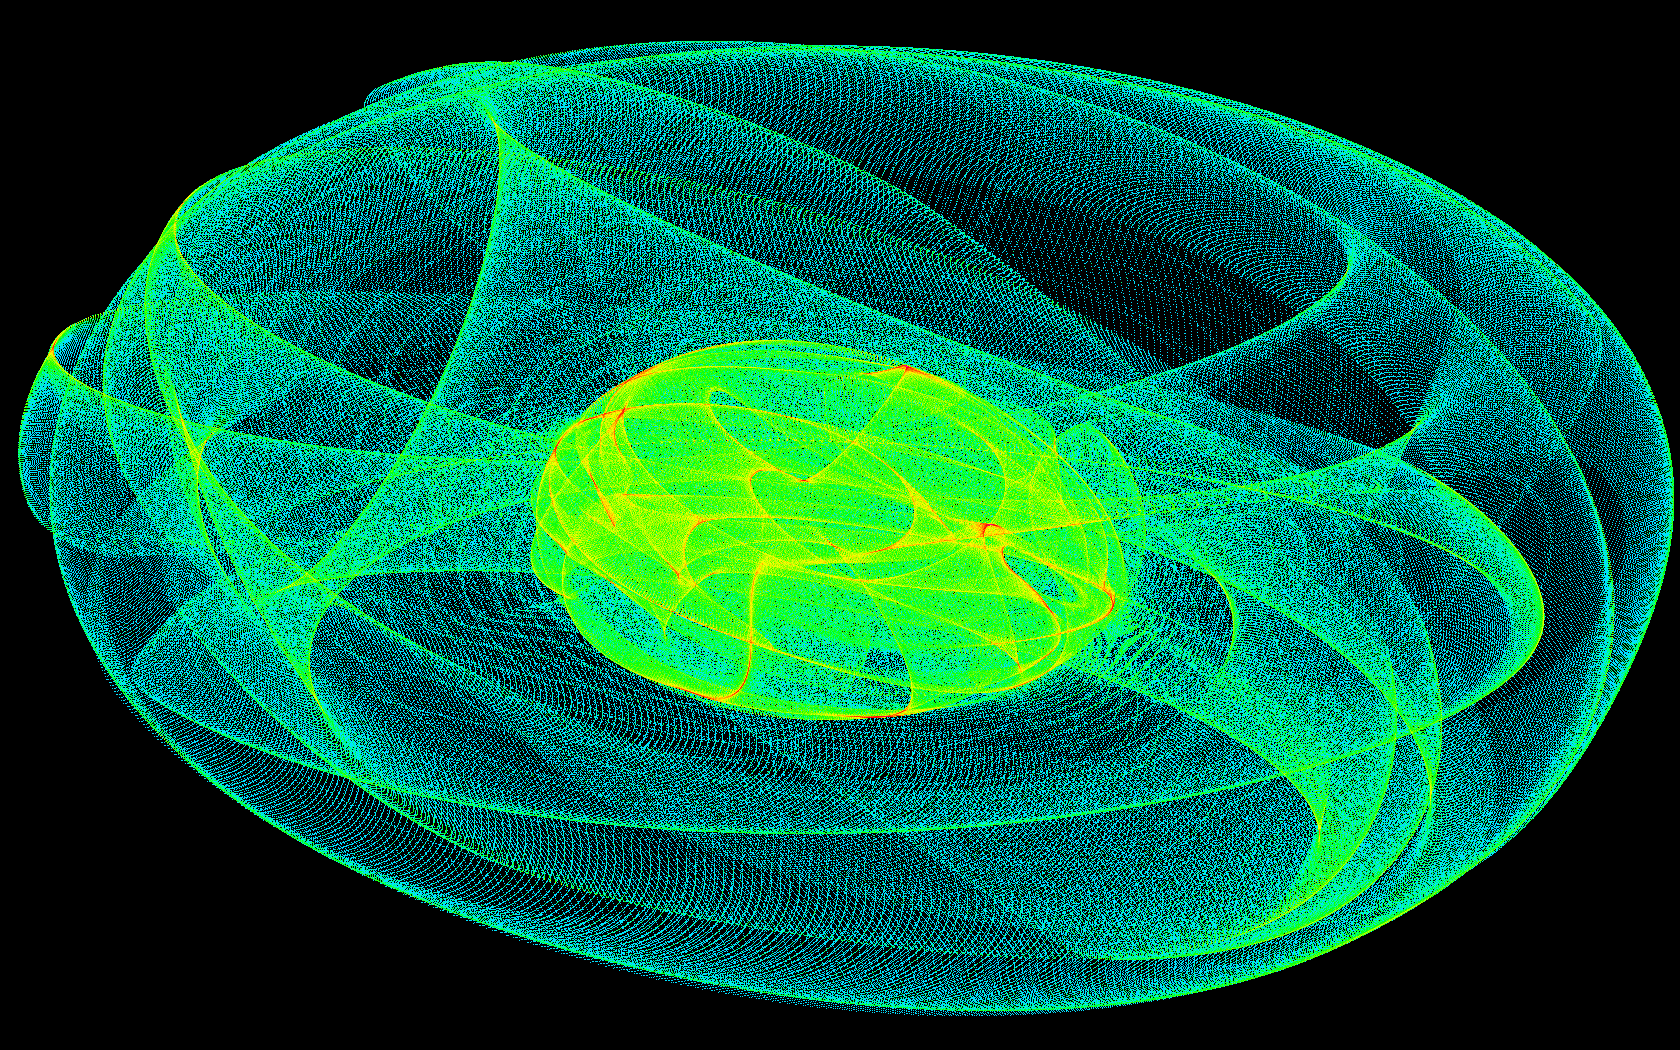
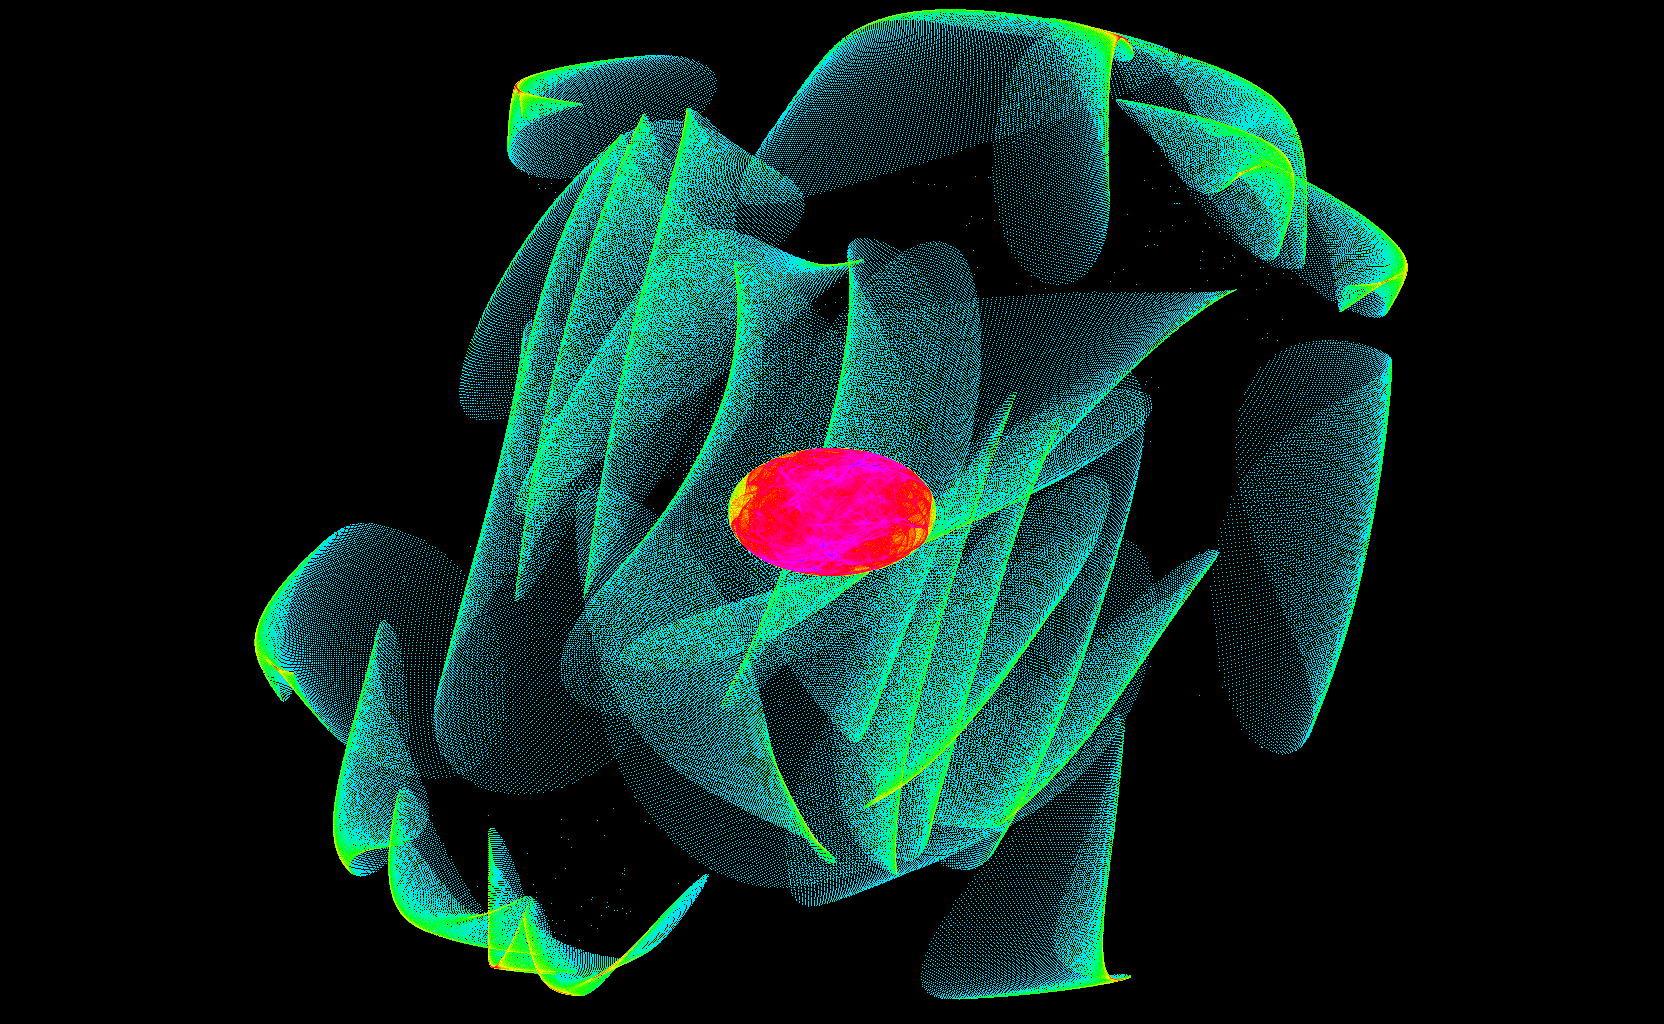
Heatmap visualization
Some examples of color images along with the heatmap visualization of the data that generated it.
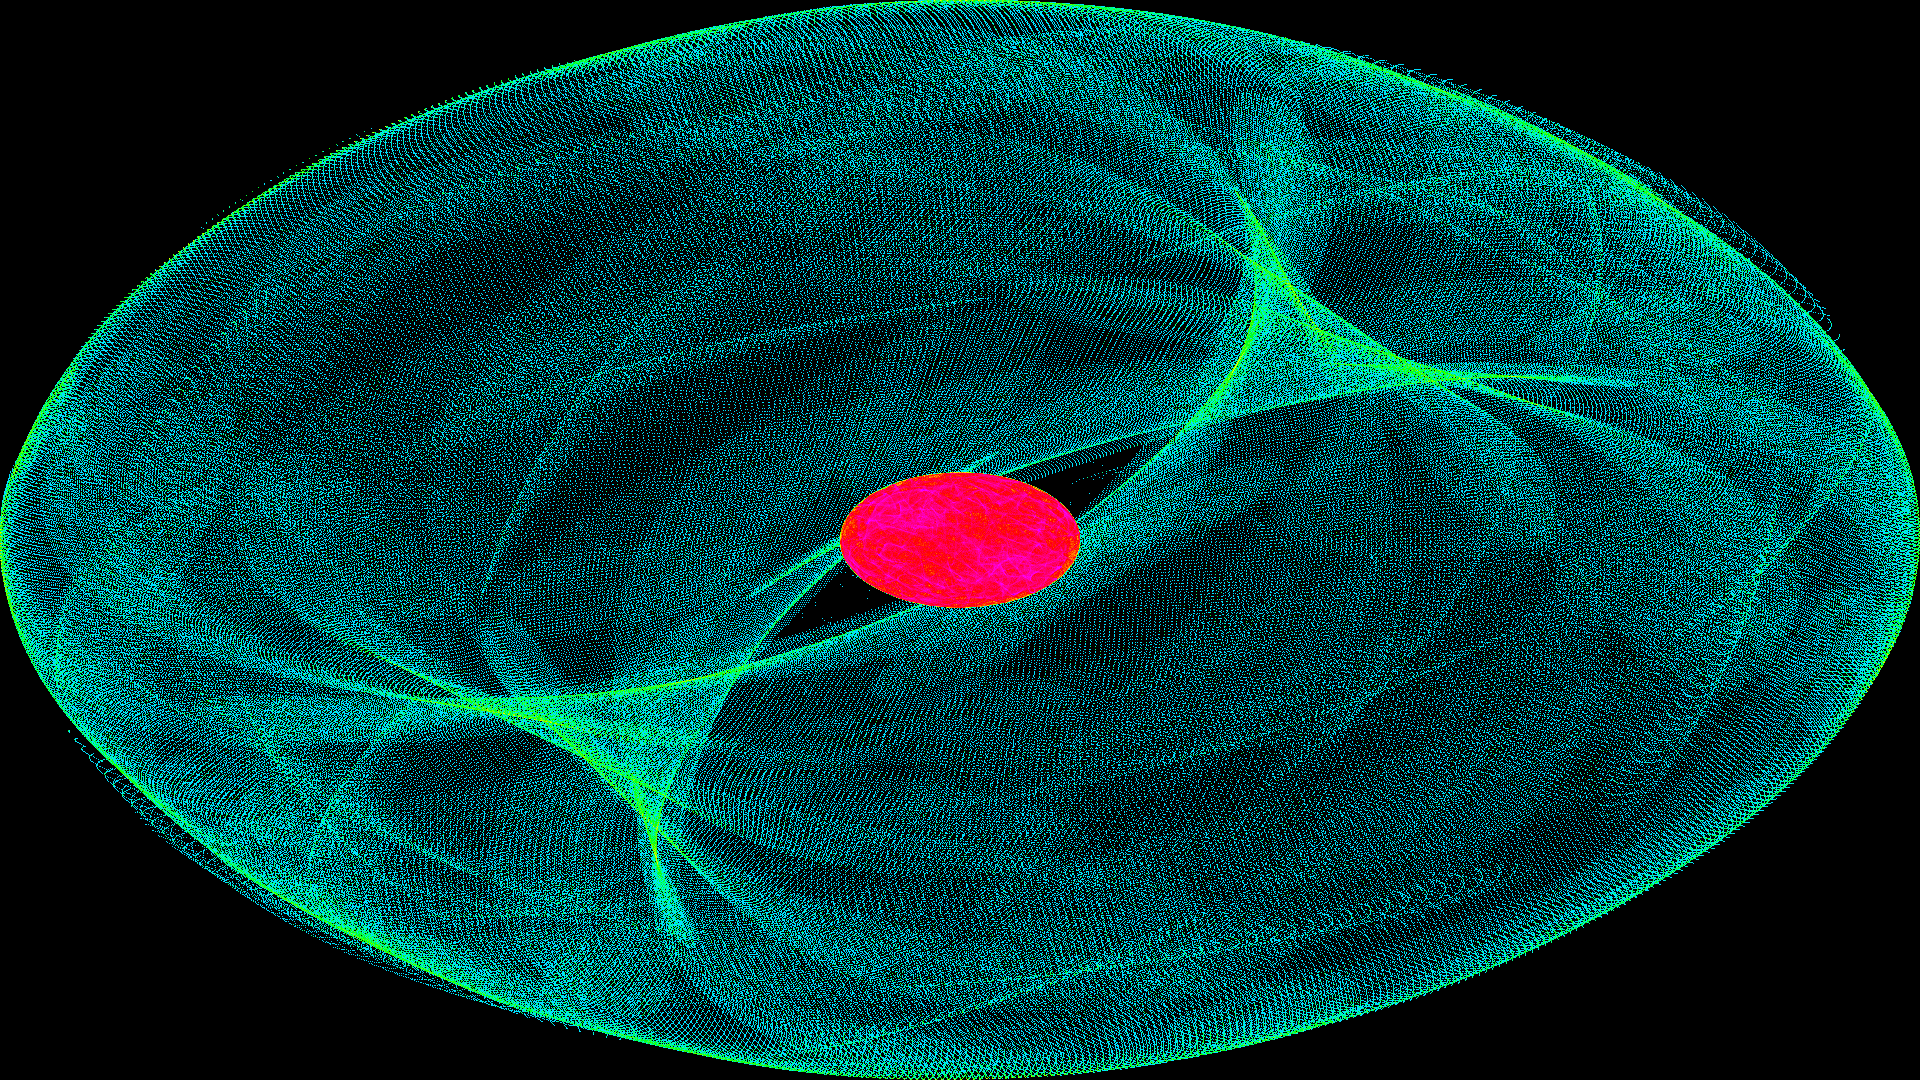
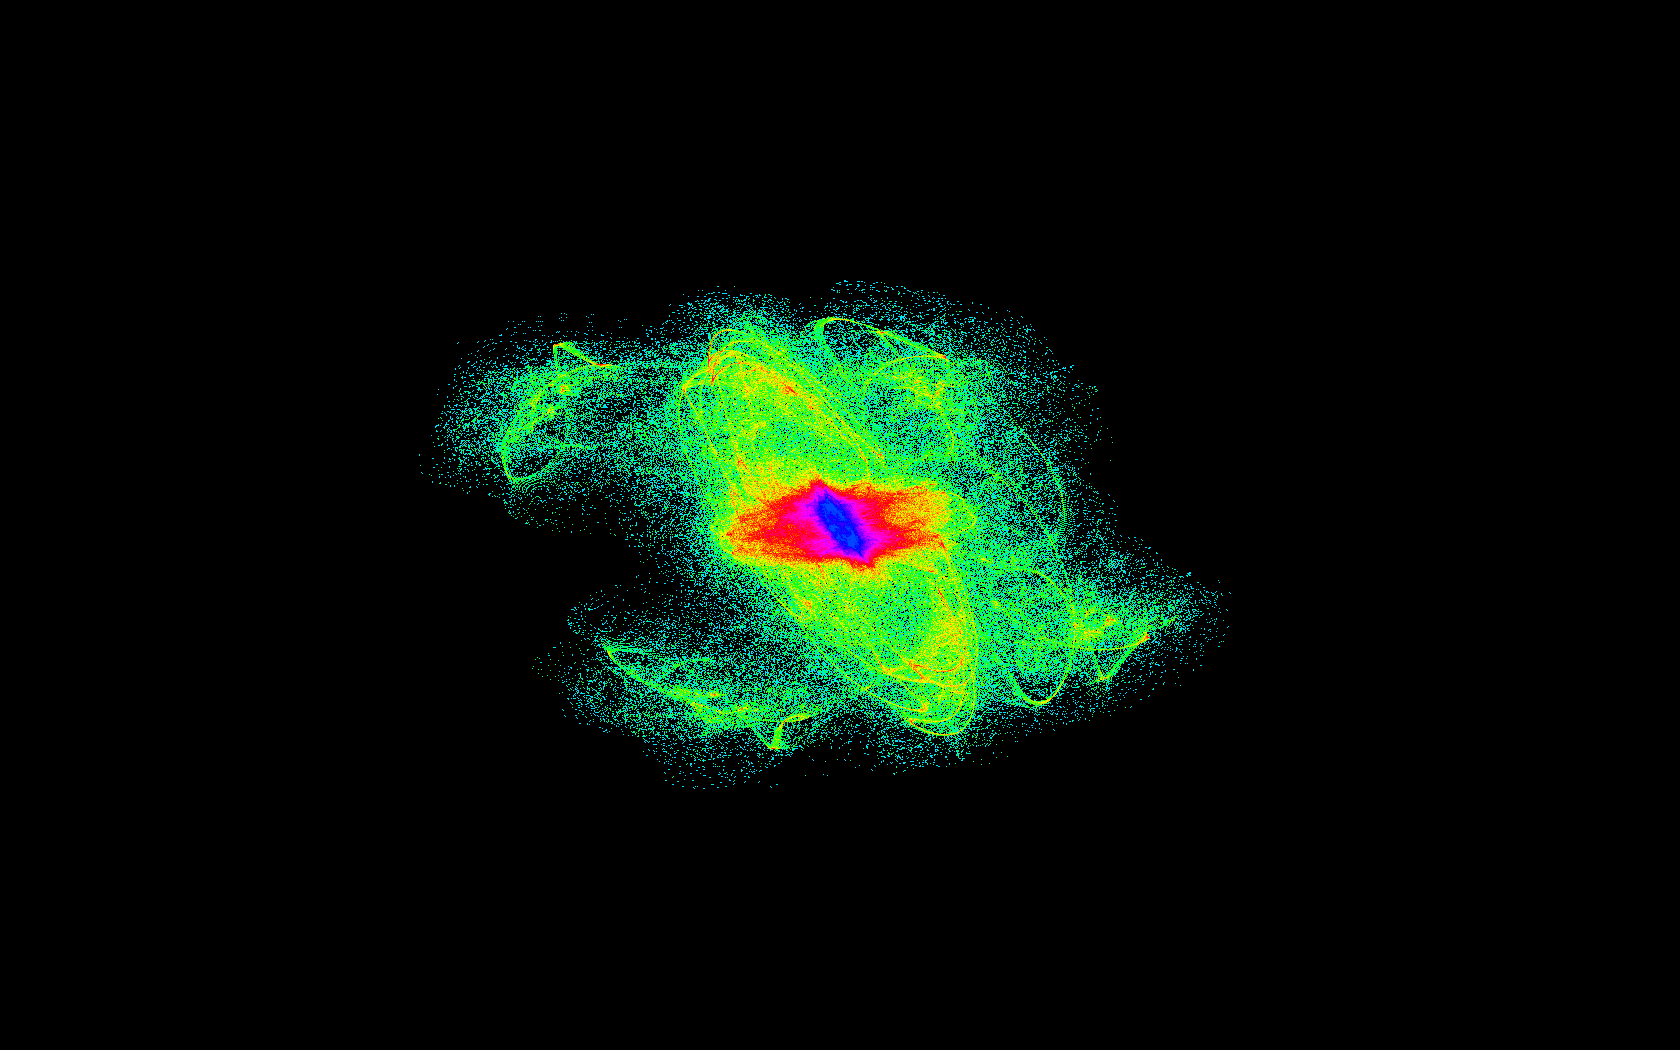
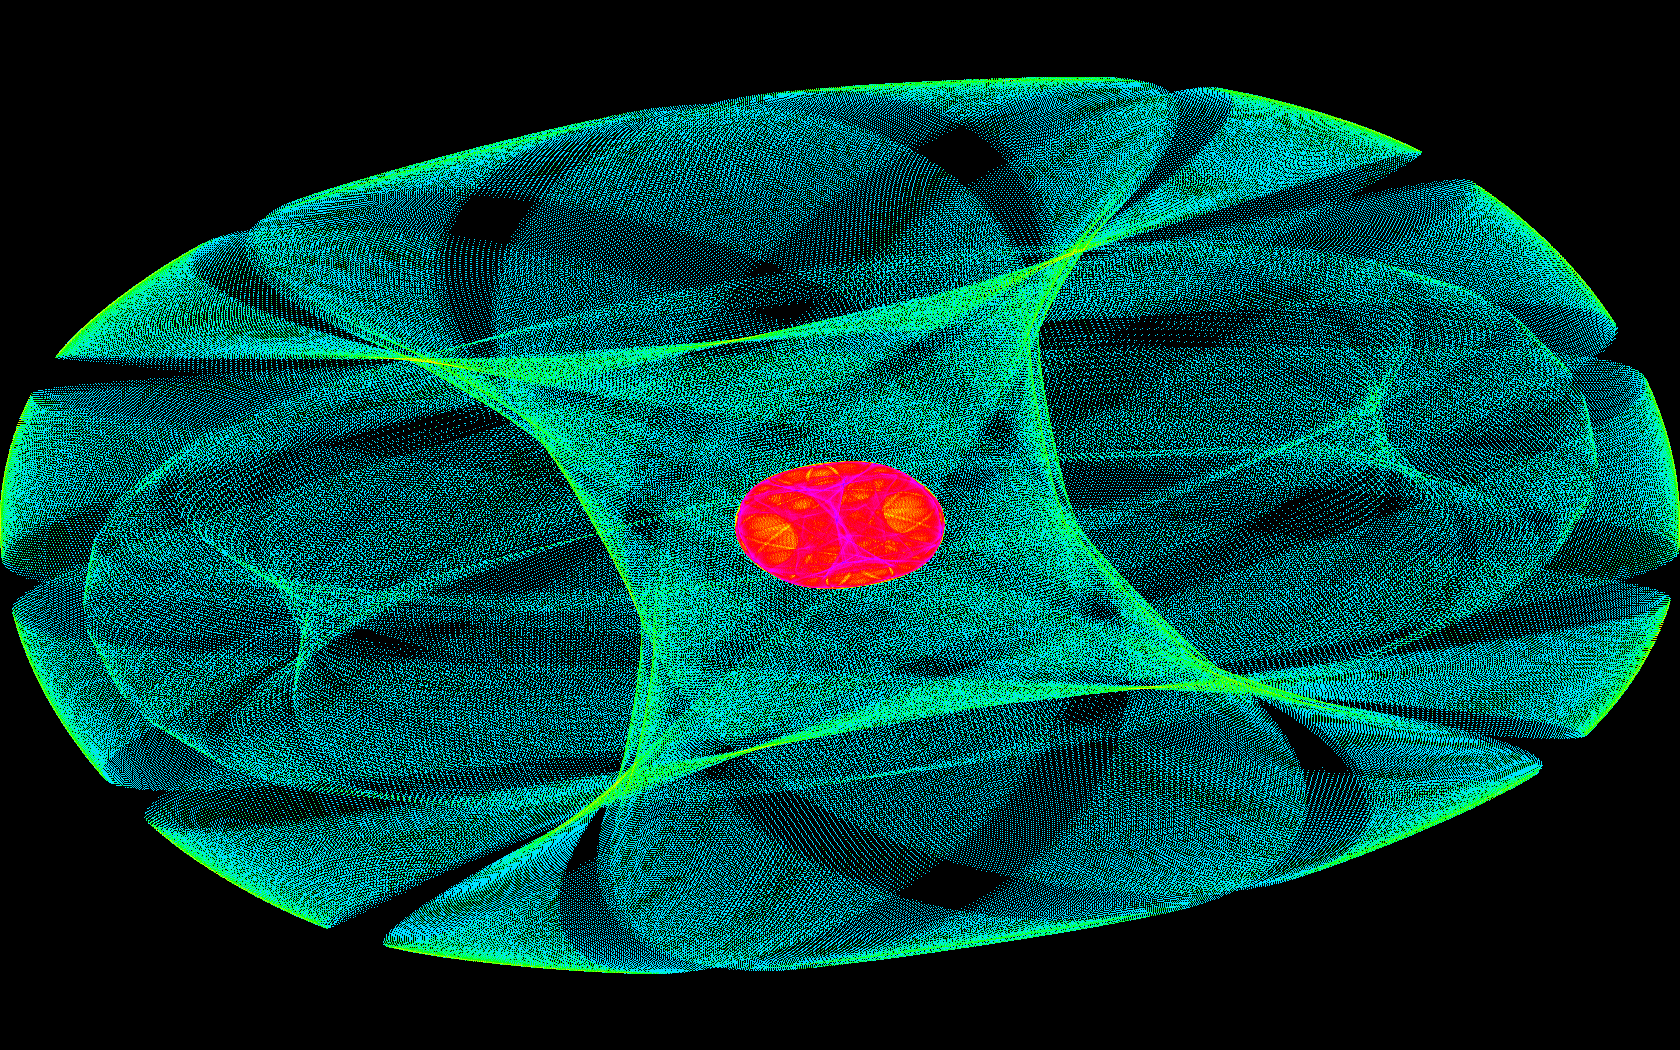
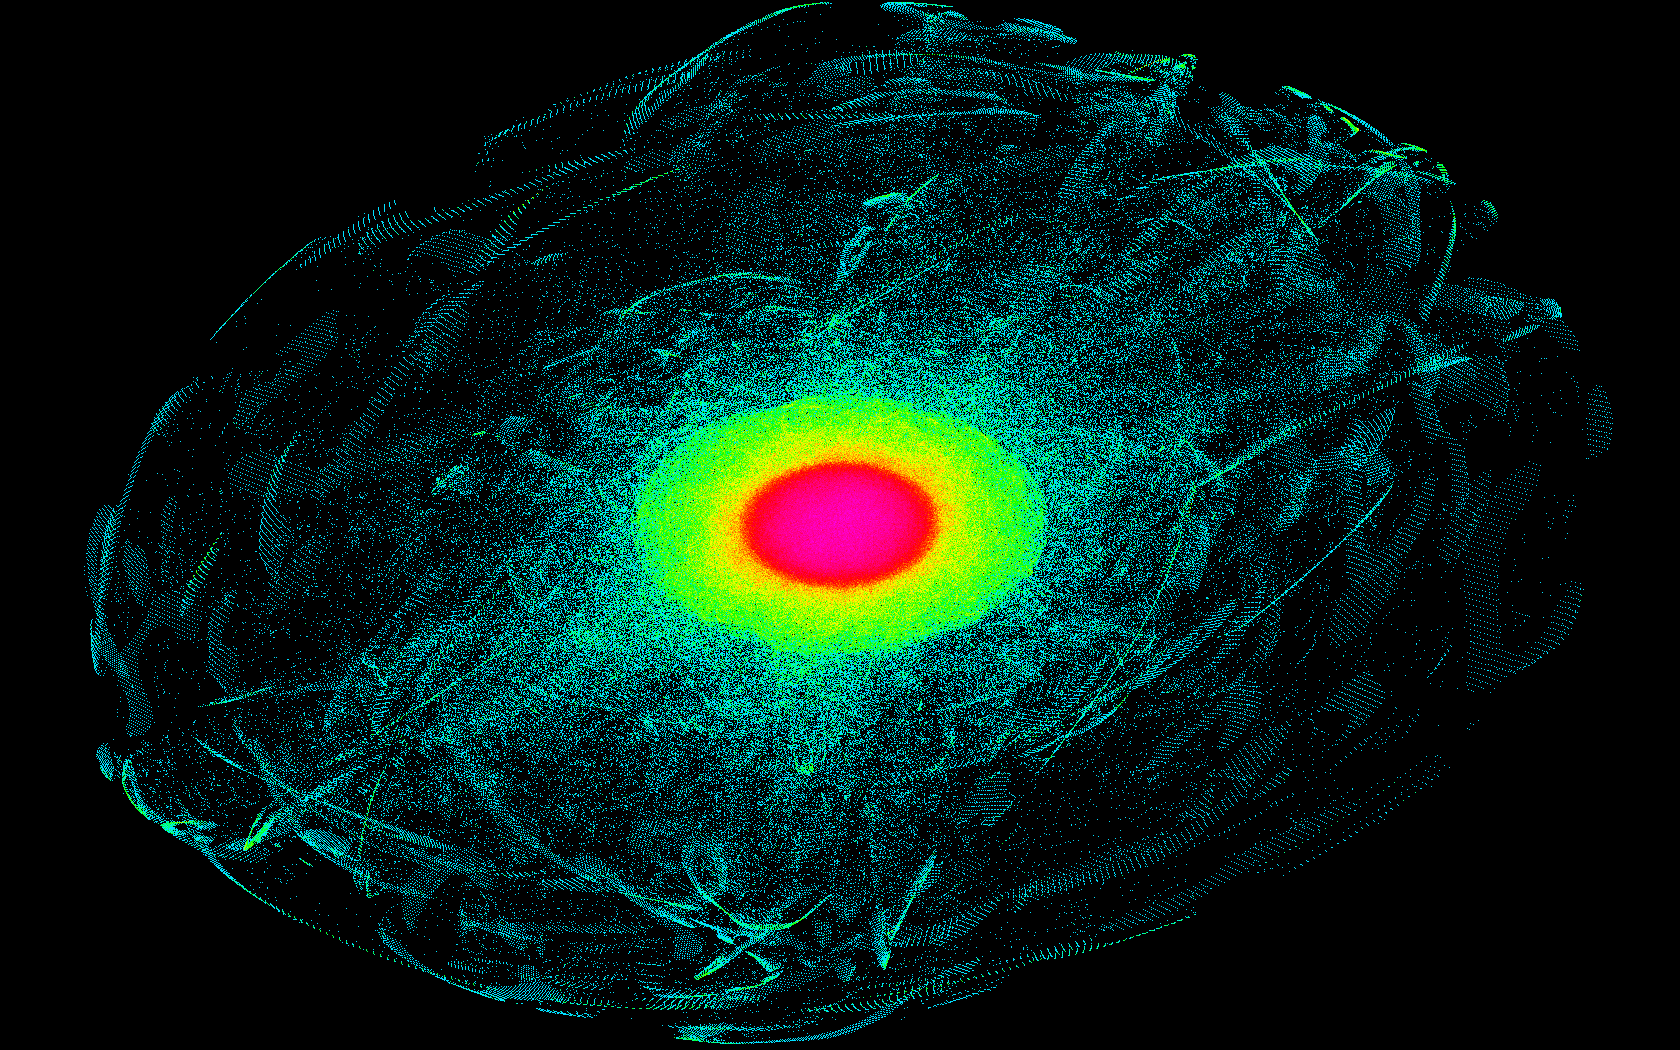
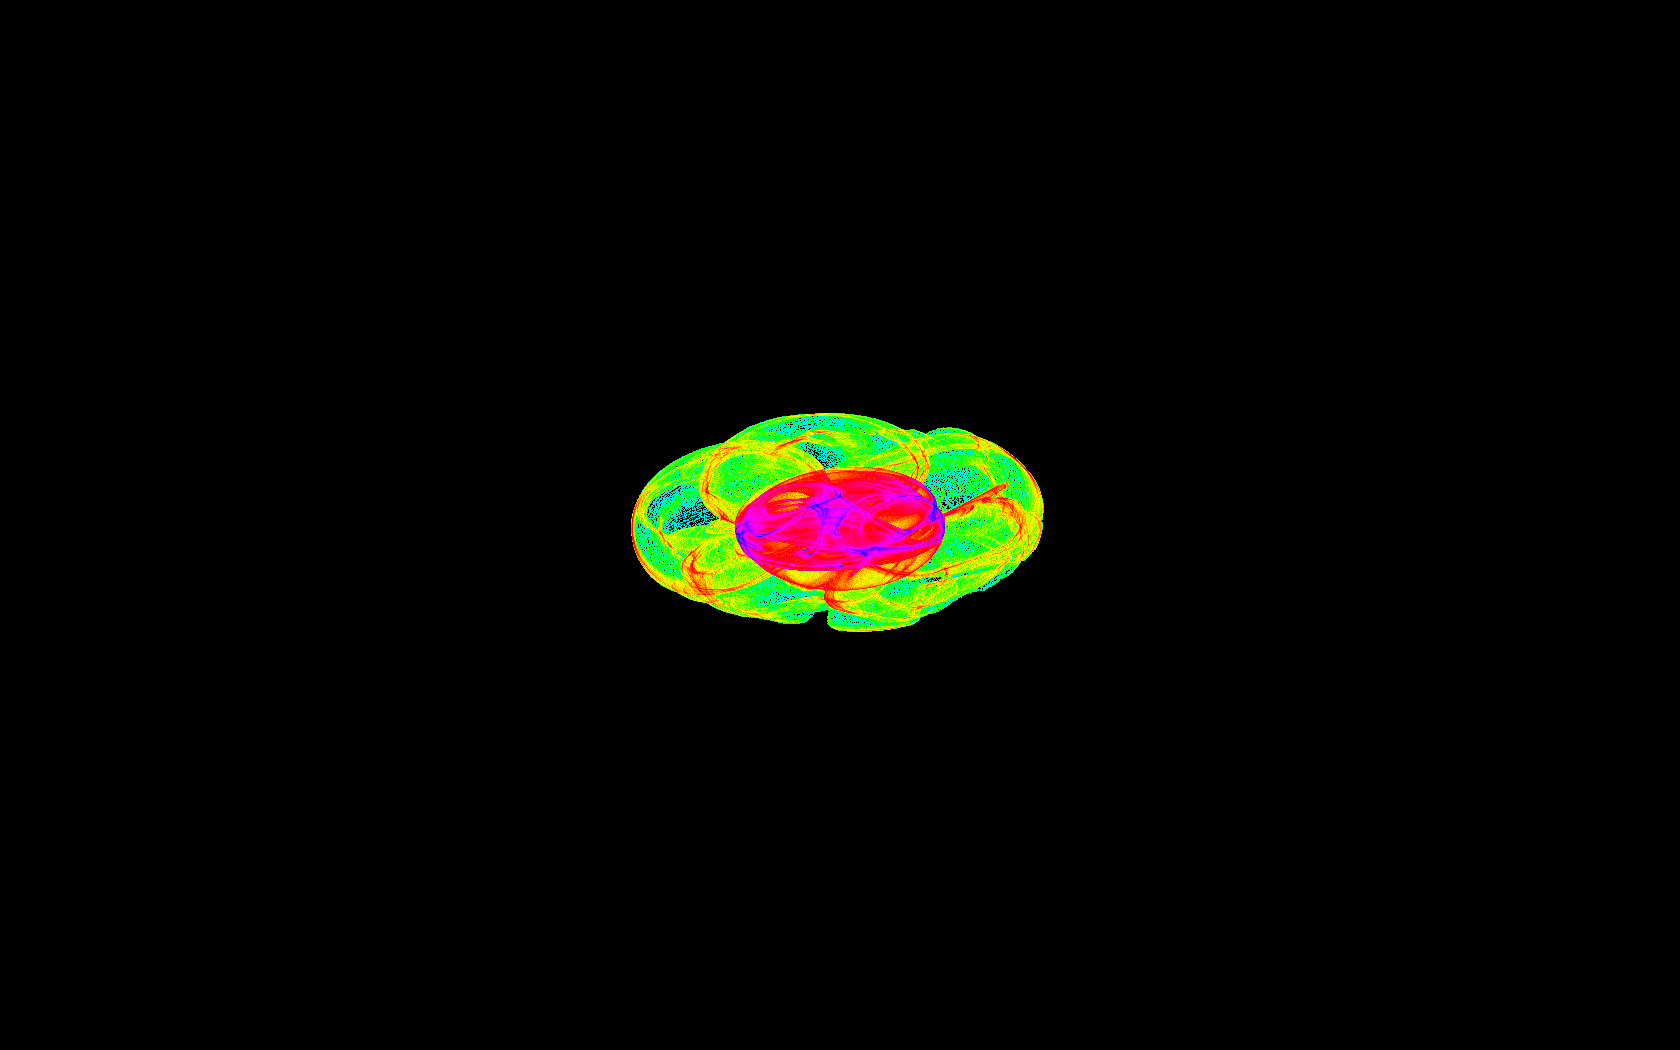
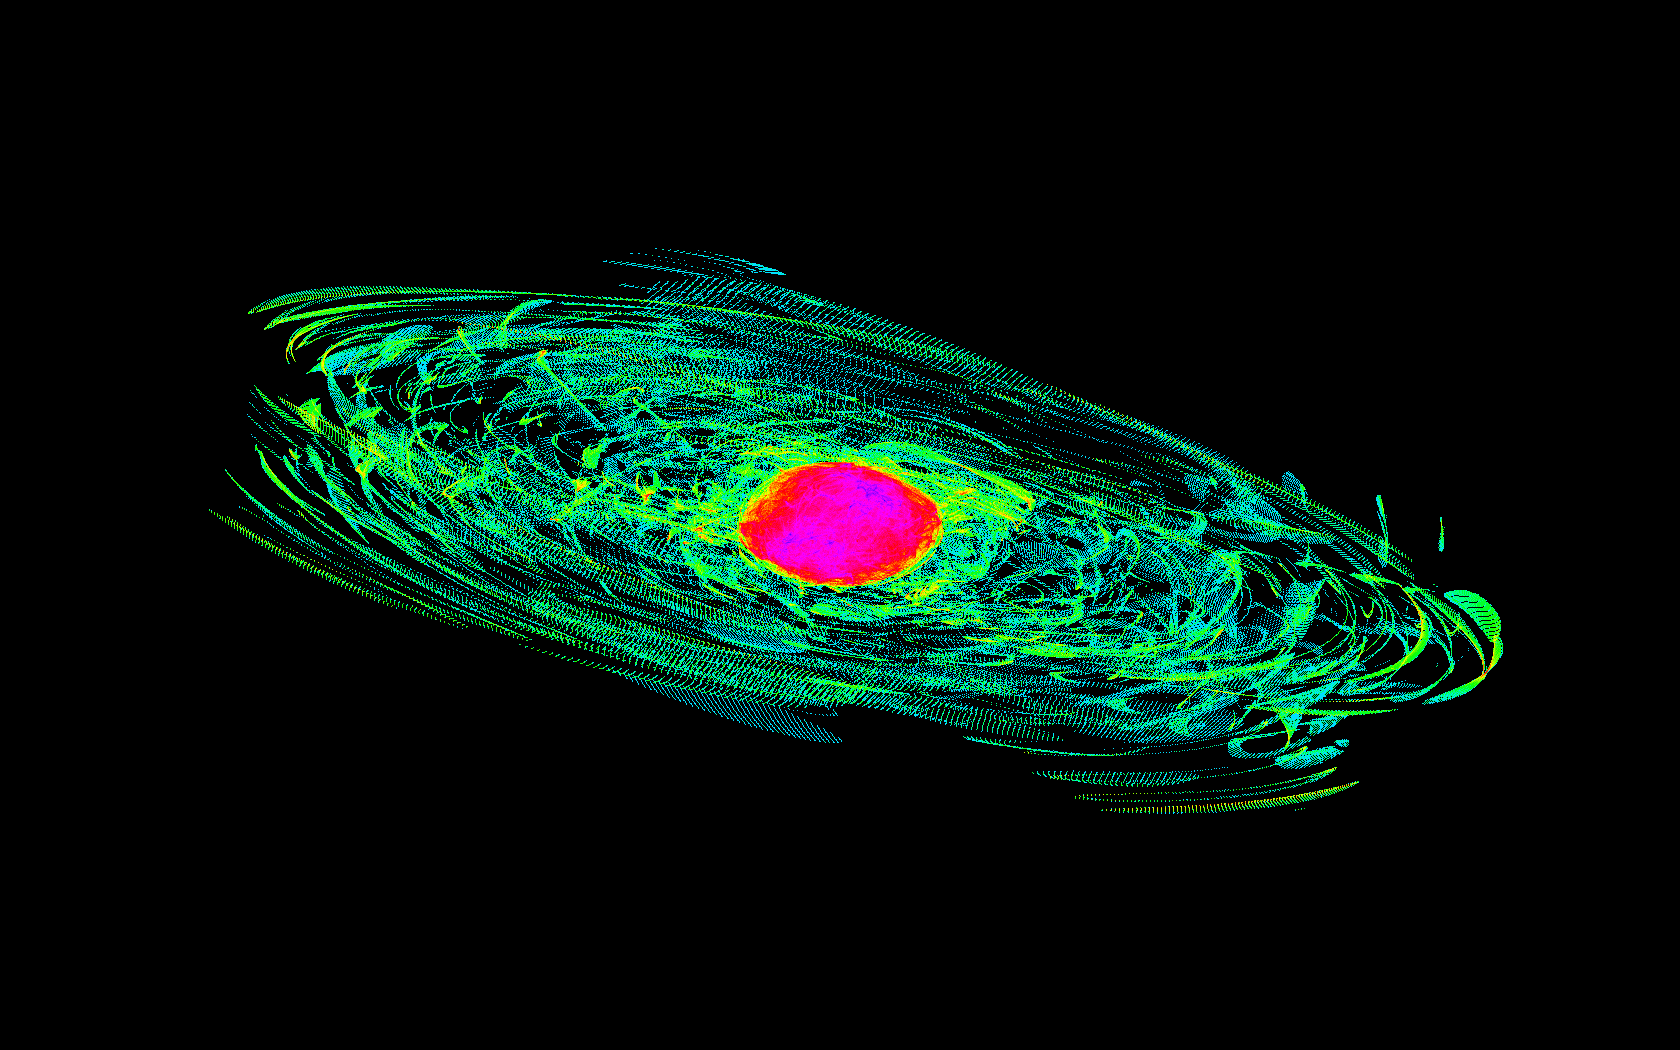
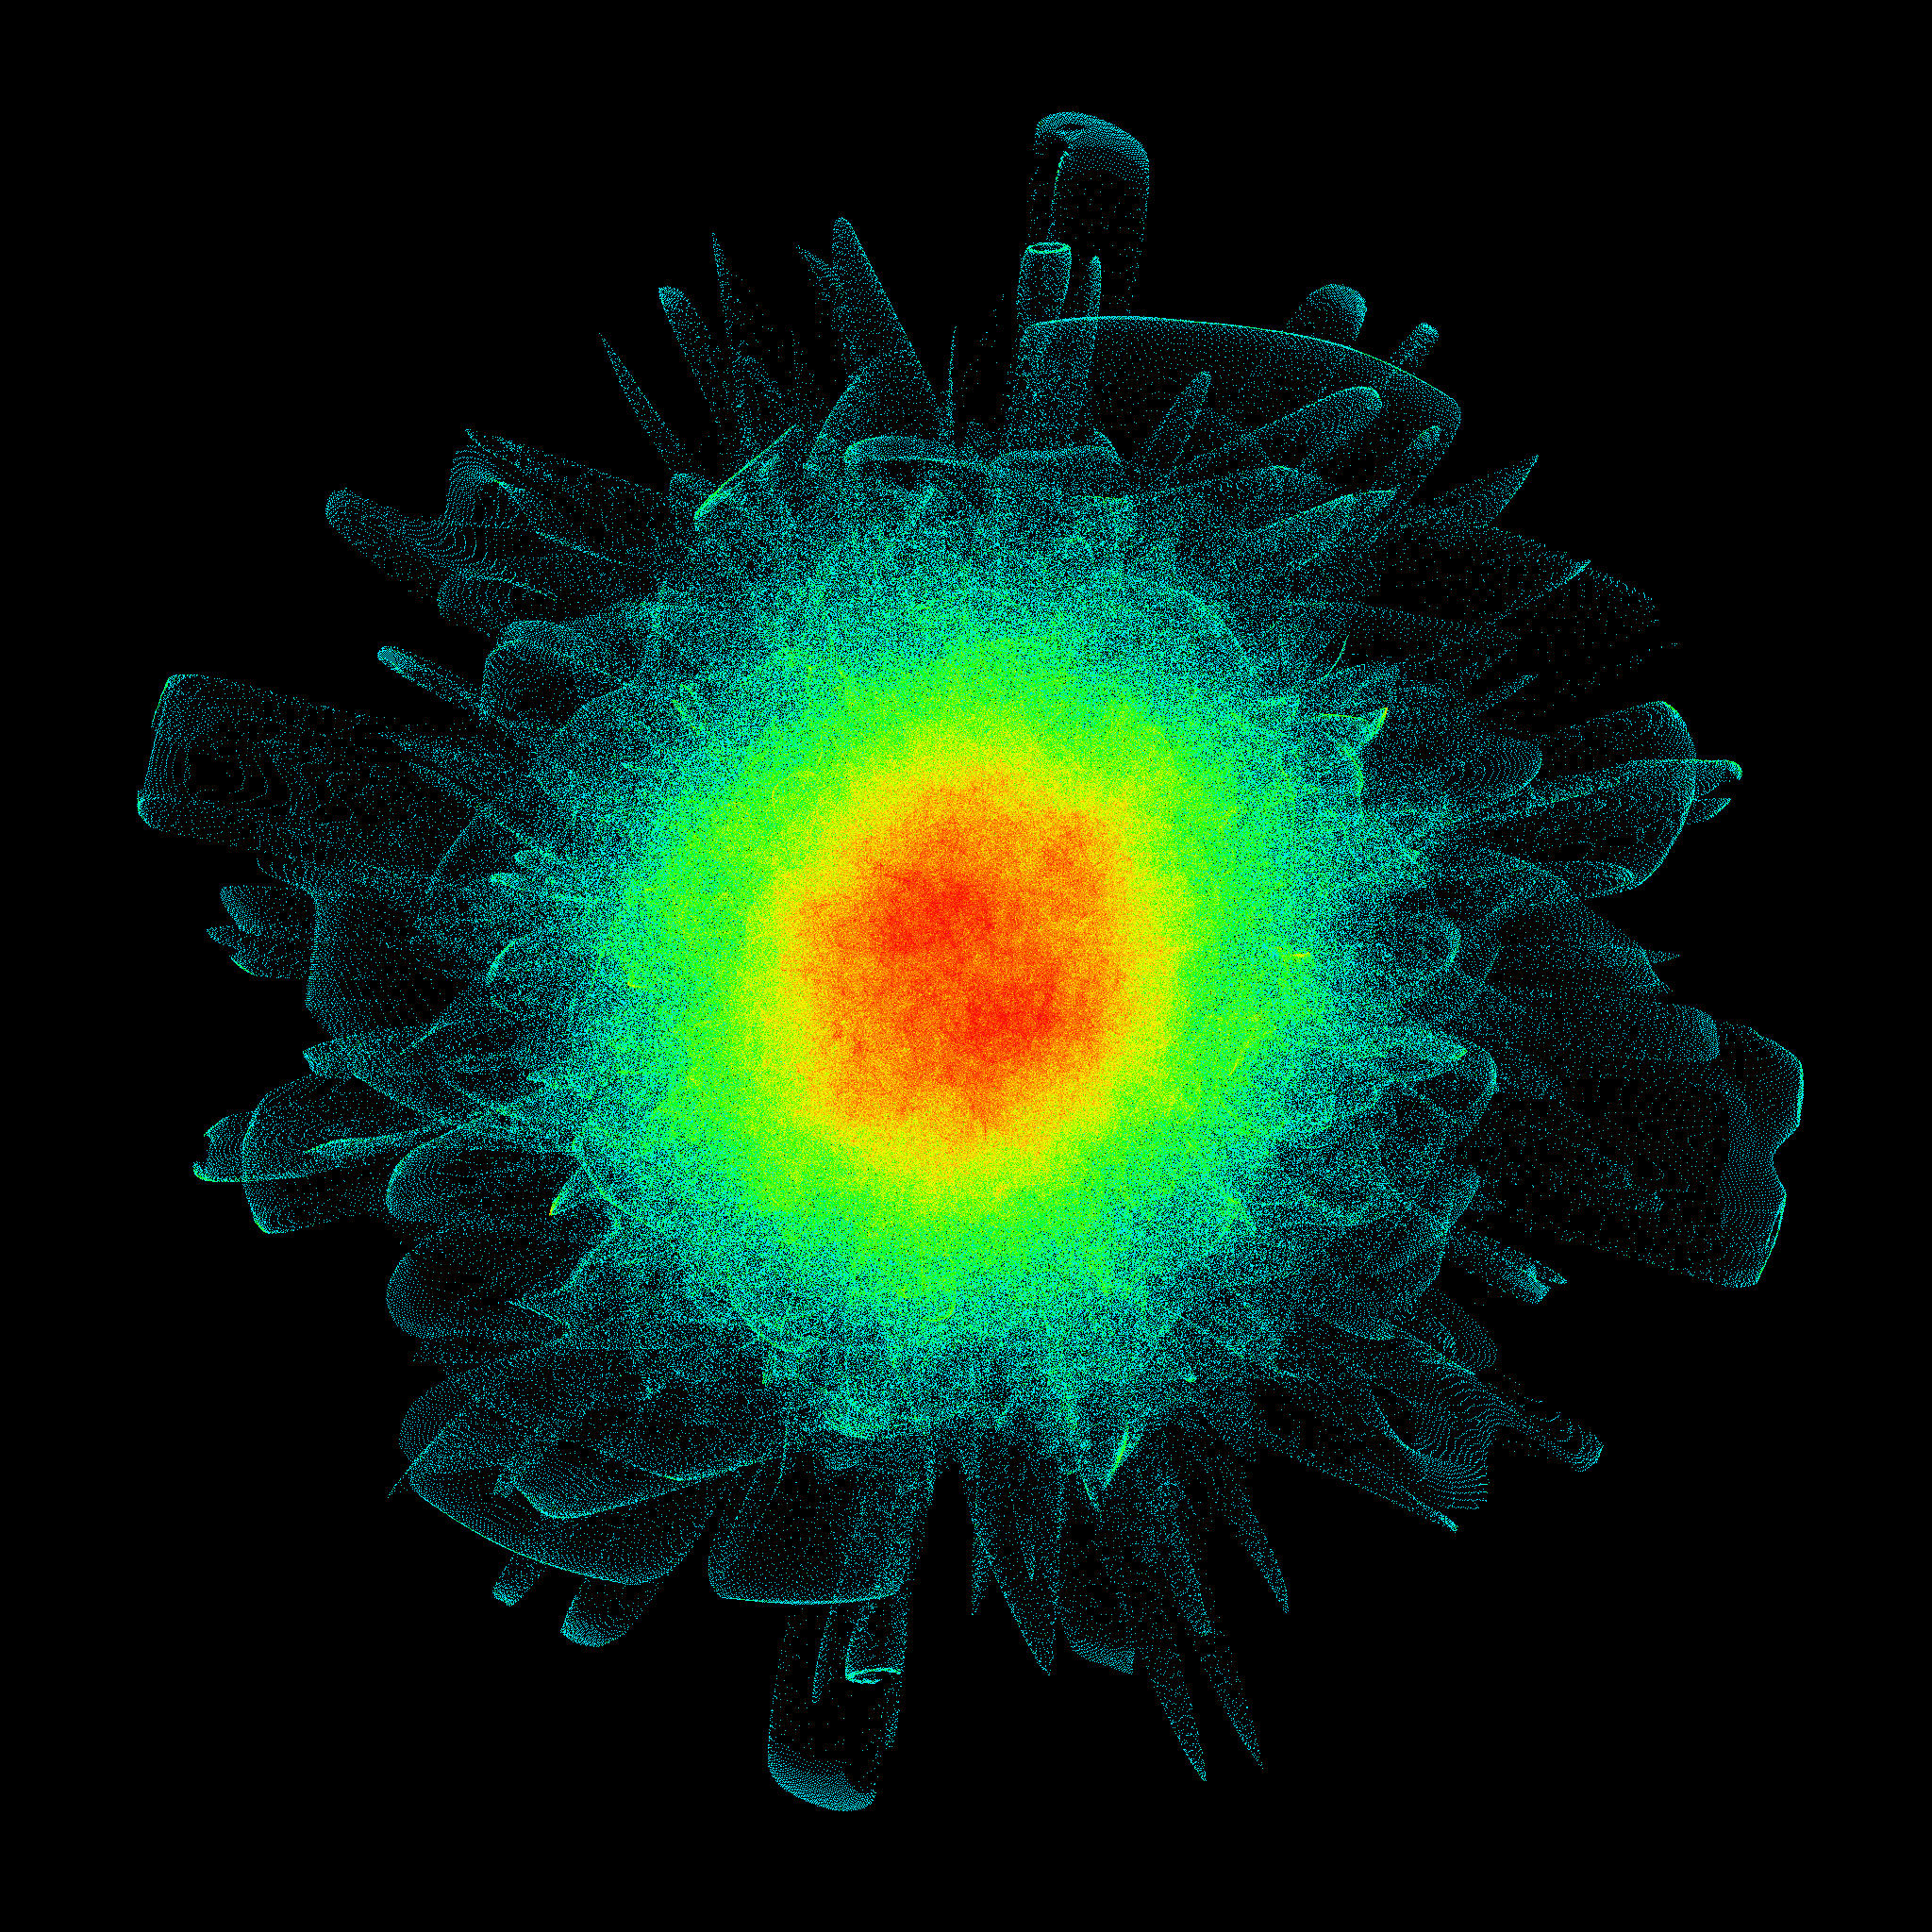
A couple more standalone examples of heatmaps:
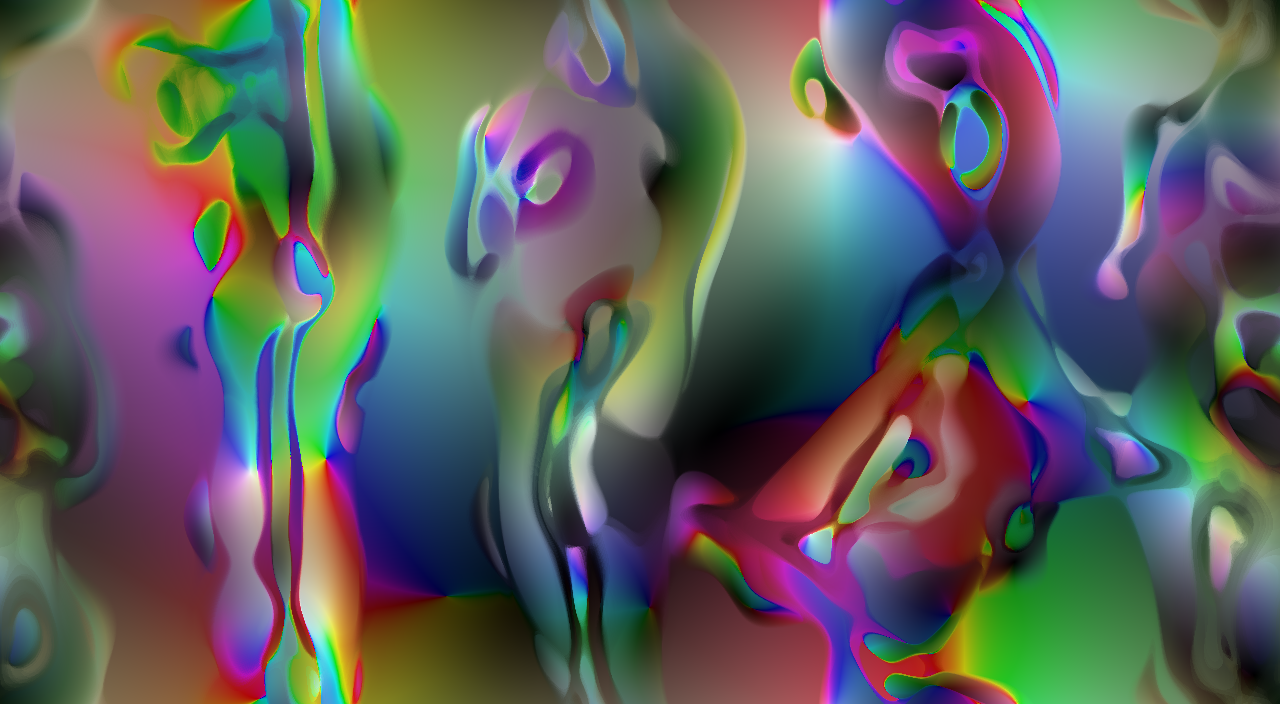
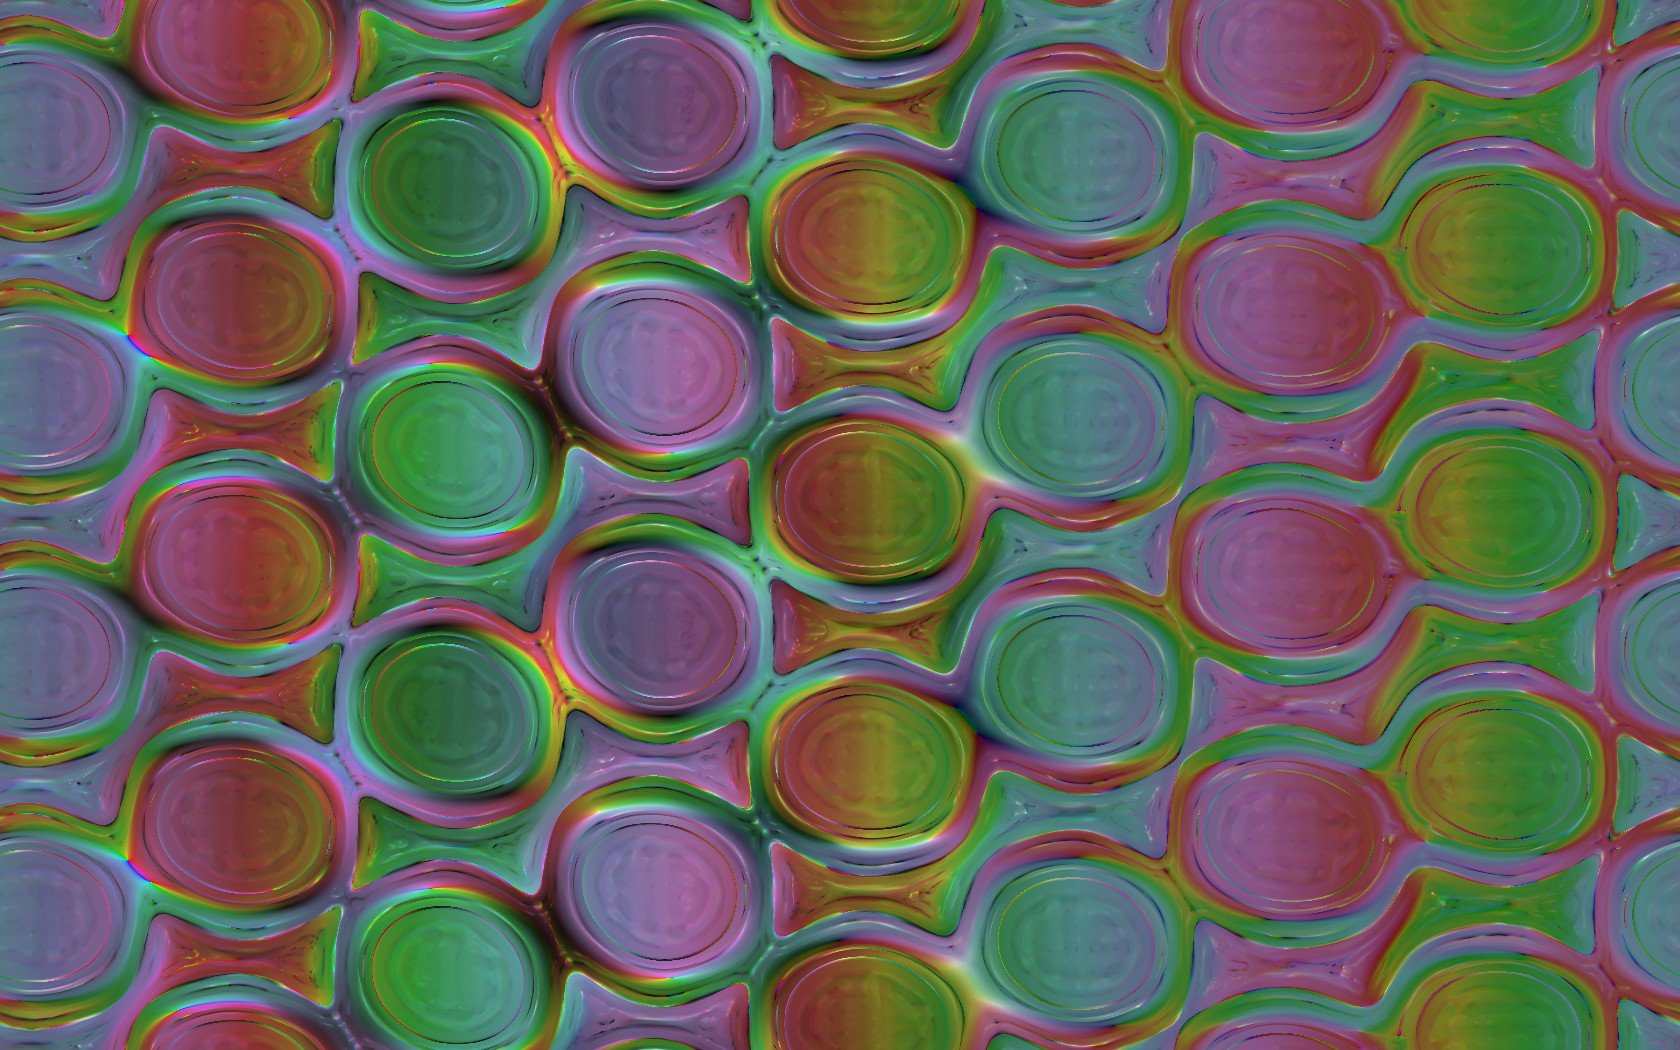
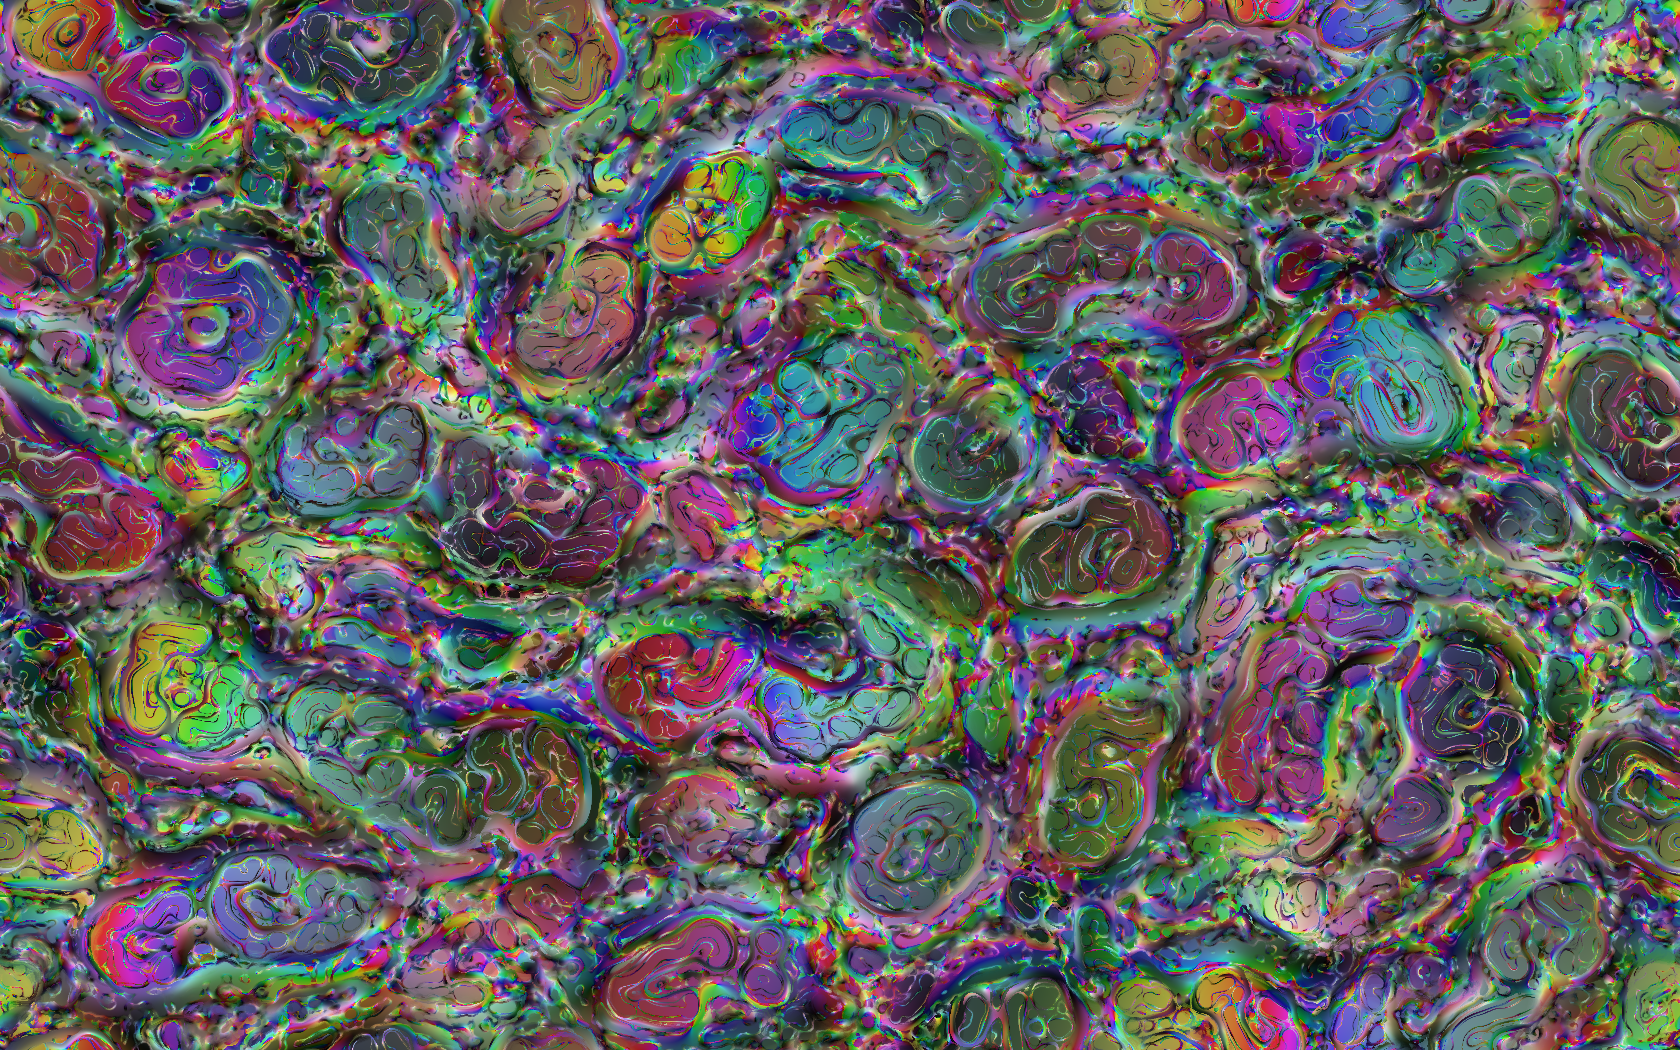
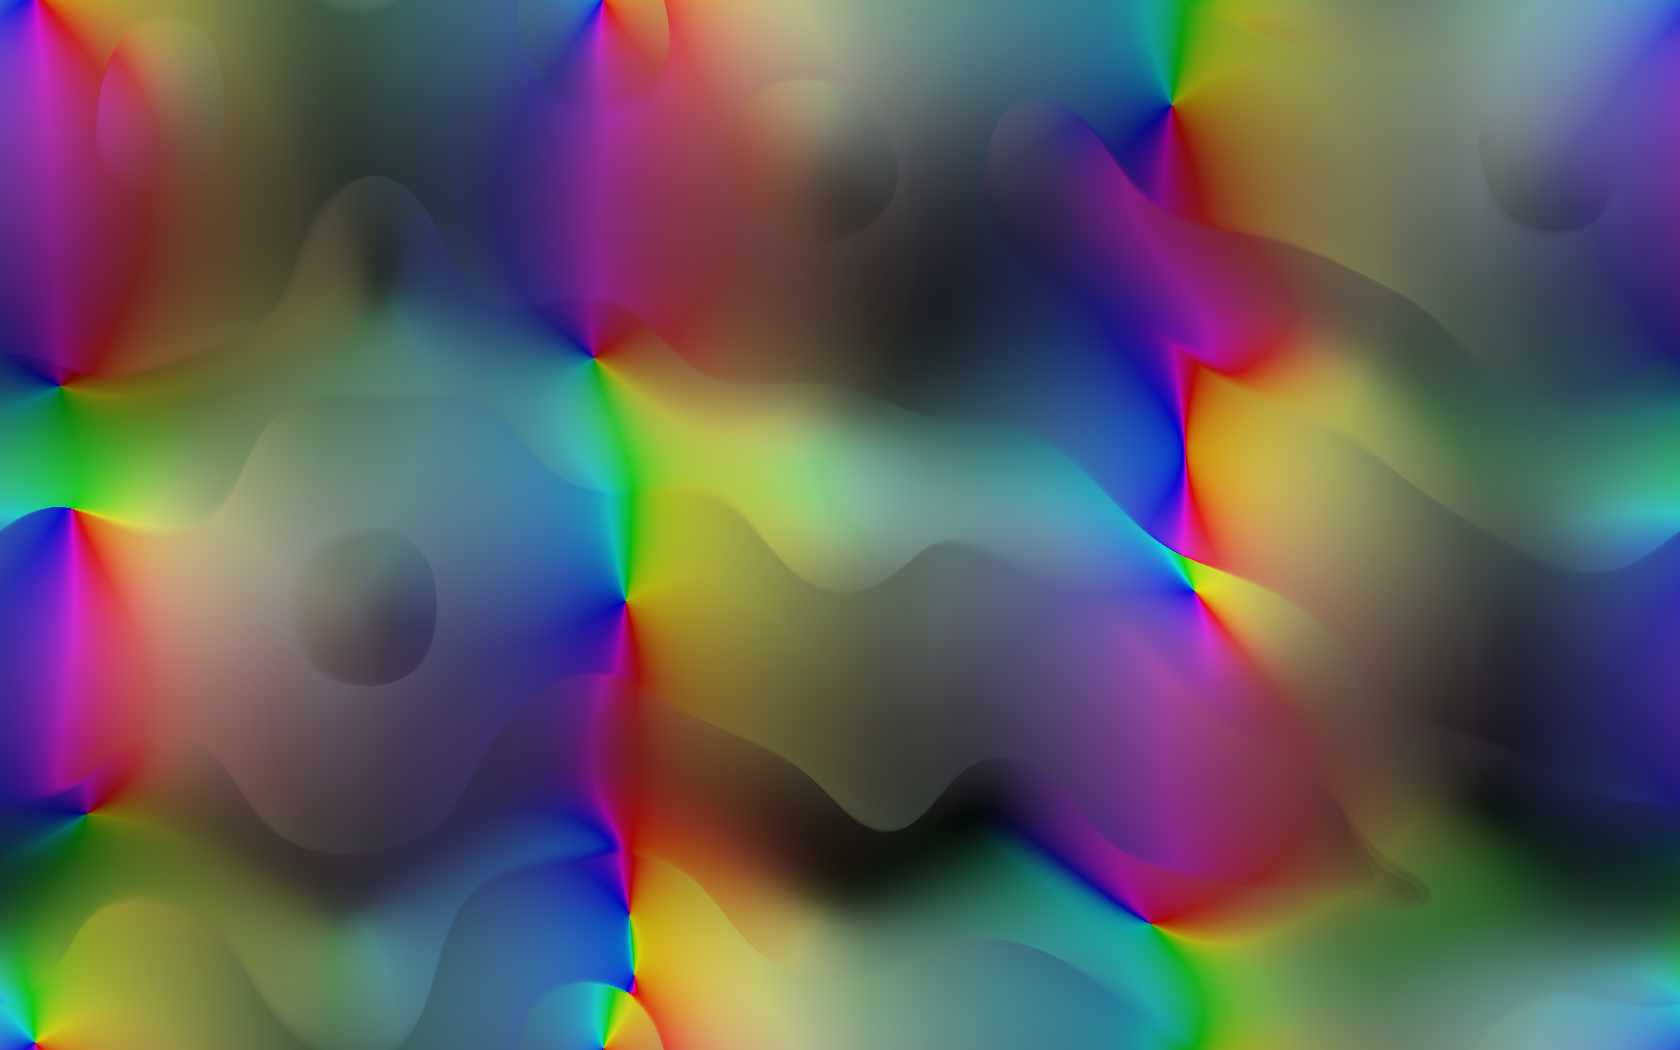
Mouse interaction
These are some images of the color visualization with mouse movement added.